If you follow the mainstream financial print media, you may have seen that many prominent  publications have recently called this stock market a ‘bubble’ and many are waiting for the elusive stock market crash! In our view, however, such bearish ‘bubble’ sentiment is precisely the reason why, in our opinion, the party is likely to continue for at least another 2-3 years. publications have recently called this stock market a ‘bubble’ and many are waiting for the elusive stock market crash! In our view, however, such bearish ‘bubble’ sentiment is precisely the reason why, in our opinion, the party is likely to continue for at least another 2-3 years.
The above introductory comments are edited excerpts from an article* by Puru Saxena (purusaxena.com) as posted on goldseek.com under the title The most hated bull.
The following article is presented courtesy of Lorimer Wilson, editor of www.munKNEE.com (Your Key to Making Money!), and www.FinancialArticleSummariesToday.com (A site for sore eyes and inquisitive minds) and has been edited, abridged and/or reformatted (some sub-titles and bold/italics emphases) for the sake of clarity and brevity to ensure a fast and easy read. This paragraph must be included in any article re-posting to avoid copyright infringement.
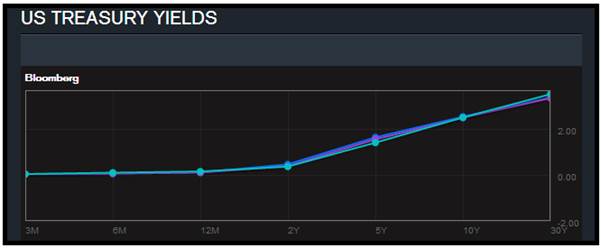
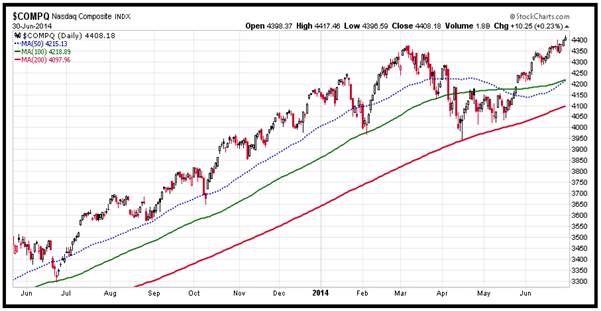
Saxena goes on to say in further edited excerpts: BIG PICTURE – The ongoing bull market is over 5 years old and both the Dow Jones Industrial Average and the S&P500 Index have climbed to record highs yet…despite the fact that this primary uptrend has tacked on impressive gains, it remains one of the most hated bull markets in recorded history... Bearish sentiment aside, the truth is that this is one of the most powerful bull markets ever, and in our opinion, the party is likely to continue for at least another 2-3 years. Undoubtedly, this primary uptrend has been powered by the Federal Reserve’s unprecedented monetary policy and it is conceivable that the bull run may continue until the inversion of the yield curve. Today, central banks are accommodative throughout the developed world and as Figure 1 below confirms, the US yield curve is steep (long term rates are higher than short term rates). Furthermore, it is notable that over the past several decades, prolonged bear markets in stocks have always been preceded by the inversion of the yield curve so, unless this time is different, it is probable that the ongoing bull market in common stocks will also end after the inversion of the yield curve; which will be followed by the next economic recession. Figure 1: US Yield Curve is steep If our assessment is correct, the yield curve will not invert for at least another 2-3 years and this implies that stocks should continue to appreciate over this time frame. Although we do not possess a crystal ball, we suspect that at the very earliest, the Federal Reserve will start raising the Fed Funds Rate by next summer. Thereafter, the Fed Funds Rate will probably be increased in baby steps (25bps) and the rate hiking cycle could continue for 2-3 years. Under this scenario, stocks may continue to rally until mid-2017, so we recommend full exposure to equities. In addition to the monetary backdrop, the various technical indicators we follow also remain supportive of this bull market. For instance,
Figure 2: NASDAQ Composite (daily chart) Bulls should take comfort from the fact that the growth stocks and technology counters are now participating in this stock market rally and over the past few weeks, they have outperformed the broad market. The favourable price action in these ‘risky’ stocks suggests that we are amidst a healthy stock market environment. In terms of specific sectors, we see strength in:
Accordingly, we have concentrated our equity and fund portfolios in these areas.Since we are now in a mature bull market we believe that:
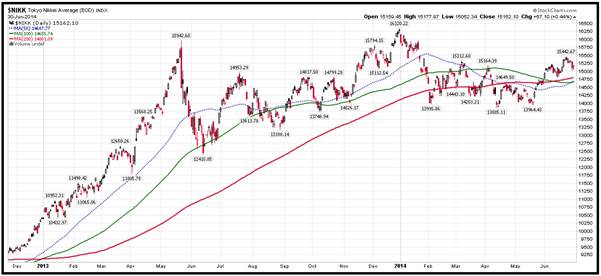
As far as geographical exposure is concerned, we like the developed world (Europe, Japan and the U.S.) and believe that it will continue to fare better than the emerging nations… Going forward, we suspect that some of the beaten-down European nations will provide outsized returns and even Japan may surprise to the upside. If you review Figure 3 below, you will note that during this lengthy consolidation phase, the Tokyo Nikkei Average has climbed back above the key moving averages and the stage may now be set for a tradable advance. Remember, Japan’s policymakers are doing everything to revive the economy and if they succeed in devaluing the Yen further, the stock market will probably embark on an explosive rally. Figure 3: Tokyo Nikkei Average (daily chart) Source: www.stockcharts.com Over in Asia, although the vast majority of the stock markets are caught in a trading range, there are a couple of interesting opportunities.
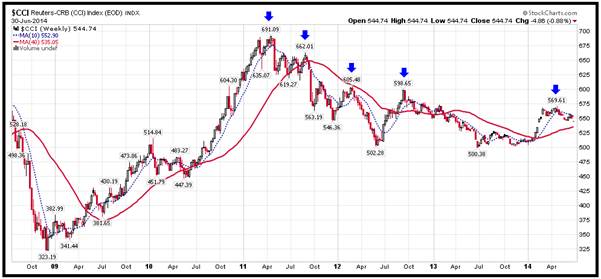
In summary, despite what you may hear on the mainstream financial media, the bull market is alive and healthy. Furthermore, bearing in mind the monetary backdrop, common stocks in our preferred areas should continue to do well for another 2-3 years. COMMODITIES – There can be no doubt that the commodities boom (primarily due to two factors – US Dollar depreciation and China’s insatiable demand) ended in April 2011 and we are now in a secular downtrend (bear market). Between 2001 and 2008, the US Dollar declined relentlessly and since commodities are priced in greenbacks, their values automatically appreciated. Furthermore, between 2003 and 2008, the world experienced its first truly global boom which caused the demand for commodities to surge; at a time when supply was relatively tight! Thereafter, during the global financial crisis, the demand for commodities temporarily plunged; thereby triggering a panic sell-off in the sector. In response to the global financial crisis, the Chinese authorities unleashed a massive stimulus program and this debt-fueled infrastructure boom caused the prices of commodities to soar for another 2 years. Eventually, the Reuters-CRB (CCI) Index topped out in April 2011 and since then, it has been drifting lower. If you review Figure 4, you will observe that ever since topping out in 2011, the CCI has been in a downtrend and each subsequent rally attempt has failed beneath the previous high (blue arrows). Such price action is typical of a primary downtrend; whereby the path of least resistance is down. Figure 4: Reuters-CRB Index (weekly chart) Source: www.stockcharts.com Currently, the CCI is trading just above the 40-week moving average and it will be interesting to see whether it will hold above this key level. If the CCI can stay above this moving average and then take out its recent high, it will open up the possibility of additional gains. Until then, the path of least resistance is down and traders should either be short or out of this sector…
Editor’s Note: The author’s views and conclusions in the above article are unaltered and no personal comments have been included to maintain the integrity of the original post. Furthermore, the views, conclusions and any recommendations offered in this article are not to be construed as an endorsement of such by the editor.
*http://news.goldseek.com/GoldSeek/1405087865.php – © GoldSeek.com, Gold Seek LLC (Copyright © 2005-2014 Puru Saxena Limited. All rights reserved. Puru Saxena publishes Money Matters, a monthly economic report, which highlights extraordinary investment opportunities in all major markets. In addition to the monthly report, subscribers also receive “Weekly Updates” covering the recent market action. Money Matters is available by subscription from www.purusaxena.com.)Stay connected!
Related Articles: 1. Cycle Analysis Suggests S&P 500 Has Topped & Will Decline To Major Low In 2016 While the majority is looking at the Megaphone Pattern correction since the 2000 high and is expecting the market to go back to the lower trend line of this pattern and to make new lows, I think that it will not happen. The opinion of the majority can be used as a contrarian indicator. I think that a healthy correction in this new Secular Bull Market could push the Dow Jones to 12500-13500 (end of 2015 – half 2016) followed by a second leg up of this new Secular Bull Market. Read More » 2. Next Bear Market Shaping Up To Be Quite the Storm – Here’s Why The U.S. stock market has been closing at one record high after another but, despite the seemingly unending investor optimism more than five years into the current bull market, some worrisome issues are continuing to build under the surface. Like all past bull markets, the latest episode will eventually come to an end and a new bear market will begin and it has the potential to be even worse than the two previous downturns since the start of the new millennium… Read More » 3. Today’s Shiller PE Suggests the Stock Market Is Overvalued By 60%! We estimate that a ‘fair price’ for the market is a Shiller PE of around 16. With the market at close to a Shiller PE of 26, the market is overvalued by about 60%. Now is not a historically good time to initiate a position in the S&P500. Read More » 4. Fearful In This Market? If Not, You Should Be! As Warren Buffett is famous for saying “…be fearful when others are greedy and greedy when others are fearful” and now is such a time. The crowd can be right for a long time, but they are rarely right at extremes and, while this time may be different, the probabilities suggest that at the very least it will be a more difficult environment for equities going forward. Read More » 5. Make No Mistake – A Major Stock Sell-off Looms! Here Are 4 Ominous Signs The 4 fundamentals and technicals discussed in this article accurately called stock market crashes in 2000 and 2007 and these same market metrics are again TODAY warning that a possible financial tsunami is brewing on the horizon. No one knows for certain WHEN the tsunami will hit Wall Street…but, without question, today’s stocks exhibit extremely exaggerated valuations, and extremes never last, so make no mistake, a major stock sell-off looms. Read More » 6. EXPECT & PLAN For A Major Stock Market Correction In the Coming Weeks/Months – Here’s Why & How The S&P 500 is now up over 180% since troughing in March 2009 and it has been almost 3 years since the stock market experienced a 10% correction. Historically, market corrections happen approximately every 2 years on average. [As such,] we think that this rally is getting very long in the tooth and we wouldn’t be surprised if we have a healthy pullback in the coming weeks or months. Read More » 7. These Indicators Should Scare the Hell Out of Anyone With A Stock Portfolio For US stocks — and by implication most other equity markets — the danger signals are piling up to the point where a case can be made that the end is, at last, near. Take a look at these examples of indicators that should scare the hell out of anyone with a big stock portfolio. Read More » 8. This Is One “Crazy, Nastyass” Stock Market! Here’s Why You can call this current stock market a blowoff or call it a Wile E. Coyote moment or call it a divergence or call it a disconnect or call it a lapse of judgement. You can call it whatever you want but I call it the “Honey Badger” market because this is one “crazy, nastyass” stock market – and I can’t believe I’m watching it happen all over again. Read More » 9. Extreme Greed By the Crowd Suggests You Show Some Fear! Here’s Why Greed may have been good for Gordon Gekko. but in the investment world it rarely is. As Warren Buffett is famous for saying “…be fearful when others are greedy and greedy when others are fearful” [and now is such a time]…to start showing some level of fear here in the face of extreme greed by the crowd. The crowd can be right for a long time, but they are rarely right at extremes. While this time may be different, the probabilities suggest that at the very least it will be a more difficult environment for equities going forward. Read More » 10. Is Now the Calm Before the Storm? I’d argue that the record low volume shows investors aren’t looking ahead as much as looking behind and reminiscing at how good things have been over the past five years or so. They’re expecting more of the same even though it’s mathematically impossible people. Read More » 11. Collapse of S&P 500 May Be Only Weeks Ahead! Here’s Why When Staple sector (i.e. defensive) stocks started to reflect greater relative strength than Discretionary sector stocks back in 2000 and again in 2007, the S&P 500 began to fall dramatically in the ensuing months. That’s happening again. Can a collapse of the S&P 500 be far behind? Read More » 12. There’s Evidence – Plenty of It – That the Bear Is No Longer Hibernating. Here’s Why The health of a market is best assessed along three vectors: fundamentals, technicals (price action) and sentiment and this is what each is saying about the health of the markets these days. Read More » 13. A 20%+ Sell-off is Brewing In the Lofty U.S. Stock Markets – Here’s Why & What the Future Holds For today’s seriously overextended and overvalued US stock markets the best-case scenario is a full-blown correction approaching 20% emerging soon while the worst case is a new cyclical bear market that ultimately leads to catastrophic 50% losses. Read More » 14. Margin Debt: It Doesn’t Matter ’til It Matters! Is Now the Time to Be Worried About the S&P 500? It doesn’t matter until it matters! IF margin debt should start decreasing swiftly, history would suggest something different is taking place in the mind of aggressive investors. Will a decline in margin debt from all-time highs matter this time? Read More » 15. A Rise In Silver Prices and a Fall In S&P 500 Index Seems Both Inevitable and Imminent – Here’s Why Silver has had three bad years while the S&P has had 5 good years. It is time for both markets to reverse. Here’s why. Read More » Last year’s “Sell in May” period was only the third time since the turn of the century that stocks have postedstockcrash-2 double-digit gains from May through October so, with stocks still near all-time highs as the calendar flips to May, do the law of averages suggest we’re on the brink of a major pullback over the next six months? Read More » 17. 2 Stock Market Indicators Are Saying “Be careful, don’t get caught up in the euphoria” In the midst of all the optimism we see towards key stock indices these days, there are two leading indicators that are flashing warning signals. They say, “Be careful, and don’t get caught up in the euphoria.” Read More » 18. Beginnings of Massive Stock Market Correction Developing: Don’t Delay, Prepare Today! No stock can resist gravity forever. What goes up must eventually come down. This is especially true for stock prices that become grotesquely distorted. We have been – and still are – living in another dotcom bubble, and – like the last one – it is inevitable that it is going to burst. Read More » 19. 3 Historically Proven Market Indicators Warn of an Impending Market Top It’s frustrating to see key stock indices keep pushing higher when historically proven market indicators are all warning of a crash ahead. Irrationality is exuberant to say the very least, and that’s why I believe this rally is counting its last days. Read More » 20. Time the Market With These Market Strength & Volatility Indicators There are many indicators available that provide information on stock and index movement to help you time the market and make money. Market strength and volatility are two such categories of indicators and a description of six of them are described in this “cut and save” article. Read on! Words: 974 Read More » 21. The Stock Market Is a Risky Place to Be – Here’s Why With both the fundamentals and the technicals saying the stock market is a risky place to be, we await its crash back to reality. Here’s why. Read More » 22. We’re on the Precipice of a 50% Drop in the U. S. Stock Market! Here’s Why Warren Buffett’s favorite indicator – the ratio of the value of U.S. stocks to GDP – is seen by him as a reliable gauge of where the market stands and these days it suggests that all the main indexes are pointing to an imminent 50% crash. Read More » 23. Stock Market Bubble Going to Burst & Unleash Destructive Forces on Global Economy The Fed has manufactured a parabolic move in the stock market…which is much more aggressive (and thus even more unsustainable) than witnessed at either the 2000 or 2007 stock market tops. Parabolas always collapse – there are never any exceptions – so when the pin finds this bubble it’s going to take down not only our stock market, but unleash a destructive force on the global economy. Read More » 24. Relax! Take Stock Market Bubble Warnings With a Grain of Salt – Here’s Why Bubble predictions are headline-grabbing claims that are sure to attract reader/viewership and more than a few worried individuals who will be pushed to act but, like all forecasts, these bubble warnings should be taken with a grain of salt. Read More »
|
 munKNEE.com Your Key to Making Money


