The mean Shiller PE ratio since 1881 is 16.53, and the median is 15.92. Based on these numbers, we can estimate that a ‘fair price’ for the market is a Shiller PE of around 16. With the market at close to a Shiller PE of 26, the market is overvalued by about 60%. Now is not a historically good time to initiate a position in the S&P500.
The above are edited excerpts from an article* by Ben Reynolds (suredividend.com} entitled How Overvalued is the Market, & Does it Matter?.
The following article is presented by Lorimer Wilson, editor of www.munKNEE.com (Your Key to Making Money!) and the FREE Market Intelligence Report newsletter (sample here) and has been edited, abridged and/or reformatted (some sub-titles and bold/italics emphases) for the sake of clarity and brevity to ensure a fast and easy read. This paragraph must be included in any article re-posting to avoid copyright infringement.
Reynolds goes on to say in further edited excerpts;
The Shiller PE Ratio Explained
The Shiller PE ratio is the current price of the S&P500 divided by average inflation adjusted earnings over the last 10 years. The Shiller PE Ratio (also known as PE10) reduces the impact of recent earnings on the price to earnings ratio.
It is based on the teachings of Benjamin Graham who advised using 10 years of earnings data to smooth out earnings increases (and decreases) resulting from fluctuations in the business cycle. The Shiller PE ratio is named after Robert Shiller, the Sterling Professor of Economics at Yale who popularized the ratio in his book Irrational Exuberance. The Shiller PE ratio removes a great deal of business cycle “noise” from the valuation calculation. The chart below shows how overvalued the market is historically.
(click to enlarge)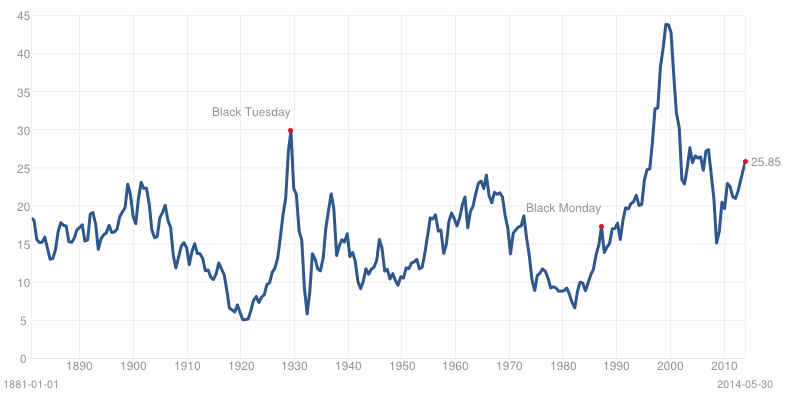 Source: multpl.com
How Overvalued is The Market?
The mean Shiller PE ratio since 1881 is 16.53, and the median is 15.92. Based on these numbers, we can estimate that a ‘fair price’ for the market is a Shiller PE of around 16. With the market at close to a Shiller PE of 26, the market is overvalued by about 60%. Now is not a historically good time to initiate a position in the S&P500. Of course, investors need not invest in the entire market.
There are two important questions that dictate whether investing in any stock is a good idea with the market historically overvalued:
- How long will the market be overvalued?
- Are there individual stocks that aren’t overvalued?
How Long will the Market be Overvalued?
Short answer, I have no idea. The market has stayed at a Shiller PE of over 25 for much of the late 1990s and 2000s. Overvaluation does not imply an immediate correction. When you don’t invest in the market, you are incurring an opportunity cost; the cost of forgoing an investment. If the market is overvalued by 60%, grows at 10%, and doesn’t correct for 7 years, you are better off investing in the overvalued market than holding cash.
Seth Klarman of the $27 billion hedge fund Baupost Group was holding about 50% of his portfolio in cash at the end of 2013. He has gone on record stating that we are in an asset bubble. A 50% cash position is a very strong signal that Seth Klarman has a high conviction the market is overpriced and will soon correct.
It is unlikely the market will remain overvalued for another decade. Historically low interest rates are creating additional demand for risky assets. The stock market benefits greatly from low interest rates. If/when interest rates rise, stocks will become less attractive investments compared to bonds and short-term treasuries.
Editor’s Note: The author’s views and conclusions in the above article are unaltered and no personal comments have been included to maintain the integrity of the original post. Furthermore, the views, conclusions and any recommendations offered in this article are not to be construed as an endorsement of such by the editor.
*http://www.suredividend.com/how-overvalued-is-the-market-does-it-matter/ (Everything Sure Dividend does is under the uncopyright license – you can copy, spread, and revise the information on Sure Dividend in any way you see fit.)
Related Articles:
1. EXPECT & PLAN For A Major Stock Market Correction In the Coming Weeks/Months – Here’s Why & How
The S&P 500 is now up over 180% since troughing in March 2009 and it has been almost 3 years since the stock market experienced a 10% correction. Historically, market corrections happen approximately every 2 years on average. [As such,] we think that this rally is getting very long in the tooth and we wouldn’t be surprised if we have a healthy pullback in the coming weeks or months. Read More »
2. Extreme Greed By the Crowd Suggests You Show Some Fear! Here’s Why
Greed may have been good for Gordon Gekko. but in the investment world it rarely is. As Warren Buffett is famous for saying “…be fearful when others are greedy and greedy when others are fearful” [and now is such a time]…to start showing some level of fear here in the face of extreme greed by the crowd. The crowd can be right for a long time, but they are rarely right at extremes. While this time may be different, the probabilities suggest that at the very least it will be a more difficult environment for equities going forward.
3. Make No Mistake – A Major Stock Sell-off Looms! Here Are 4 Ominous Signs
The 4 fundamentals and technicals discussed in this article accurately called stock market crashes in 2000 and 2007 and these same market metrics are again TODAY warning that a possible financial tsunami is brewing on the horizon. No one knows for certain WHEN the tsunami will hit Wall Street…but, without question, today’s stocks exhibit extremely exaggerated valuations, and extremes never last, so make no mistake, a major stock sell-off looms.
4. These Indicators Should Scare the Hell Out of Anyone With A Stock Portfolio
For US stocks — and by implication most other equity markets — the danger signals are piling up to the point where a case can be made that the end is, at last, near. Take a look at these examples of indicators that should scare the hell out of anyone with a big stock portfolio.
5. Remember the “Nifty 50″? It’s Back! What Does It Means For the Markets Going Forward?
Market historians will recall the term “Nifty 50” originated in the 1960’s bull market to describe 50 wildly popular large-cap stocks at the time. Interestingly, some of the same names from that list are leading the market higher today. The question for investors, of course, is what this selective advance means for the markets going forward.
6. This Is One “Crazy, Nastyass” Stock Market! Here’s Why
You can call this current stock market a blowoff or call it a Wile E. Coyote moment or call it a divergence or call it a disconnect or call it a lapse of judgement. You can call it whatever you want but I call it the “Honey Badger” market because this is one “crazy, nastyass” stock market – and I can’t believe I’m watching it happen all over again. Read More »
7. Are You A Bull Or A Bear? Here Are Indicators & Charts That Support Your Thesis
The current U.S. equity market has something for everyone. Whether you are bullish or bearish, there is no shortage of indicators or charts you can use to support your thesis. Let’s run through both the Bull and the Bear case here. In the spirit of Confirmation Bias, feel free to skip ahead to the part that best supports your current positioning. Read More »
8. Are We In Phase 3 – the Final Phase – of This Bull Market Yet?
Are we in the third phase of a bull market? Most who will read this article will immediately say “no” but isn’t that what was always believed during the “mania” phase of every previous bull market cycle? With the current bull market now stretching into its sixth year; it seems appropriate to review the three very distinct phases of historical bull market cycles. Read More »
9. Is Now the Calm Before the Storm?
I’d argue that the record low volume shows investors aren’t looking ahead as much as looking behind and reminiscing at how good things have been over the past five years or so. They’re expecting more of the same even though it’s mathematically impossible people. Read More »
10. Should You Care What’s Happening On the Nikkei 225? YES! Here’s Why
Should markets around the world really care about what the Nikkei 225 Index does? The Power of the Pattern suggests “yes”! Here’s why. Read More »
11. Collapse of S&P 500 May Be Only Weeks Ahead! Here’s Why
When Staple sector (i.e. defensive) stocks started to reflect greater relative strength than Discretionary sector stocks back in 2000 and again in 2007, the S&P 500 began to fall dramatically in the ensuing months. That’s happening again. Can a collapse of the S&P 500 be far behind? Read More »
12. There’s Evidence – Plenty of It – That the Bear Is No Longer Hibernating. Here’s Why
The health of a market is best assessed along three vectors: fundamentals, technicals (price action) and sentiment and this is what each is saying about the health of the markets these days. Read More »
13. A 20%+ Sell-off is Brewing In the Lofty U.S. Stock Markets – Here’s Why & What the Future Holds
For today’s seriously overextended and overvalued US stock markets the best-case scenario is a full-blown correction approaching 20% emerging soon while the worst case is a new cyclical bear market that ultimately leads to catastrophic 50% losses. Read More »
14. Margin Debt: It Doesn’t Matter ’til It Matters! Is Now the Time to Be Worried About the S&P 500?
It doesn’t matter until it matters! IF margin debt should start decreasing swiftly, history would suggest something different is taking place in the mind of aggressive investors. Will a decline in margin debt from all-time highs matter this time? Read More »
15. 2 Stock Market Indicators Are Saying “Be careful, don’t get caught up in the euphoria”
In the midst of all the optimism we see towards key stock indices these days, there are two leading indicators that are flashing warning signals. They say, “Be careful, and don’t get caught up in the euphoria.” Read More »
16. Beginnings of Massive Stock Market Correction Developing: Don’t Delay, Prepare Today!
No stock can resist gravity forever. What goes up must eventually come down. This is especially true for stock prices that become grotesquely distorted. We have been – and still are – living in another dotcom bubble, and – like the last one – it is inevitable that it is going to burst. Read More »
17. 3 Historically Proven Market Indicators Warn of an Impending Market Top
It’s frustrating to see key stock indices keep pushing higher when historically proven market indicators are all warning of a crash ahead. Irrationality is exuberant to say the very least, and that’s why I believe this rally is counting its last days. Read More »
18. The Stock Market Is a Risky Place to Be – Here’s Why
With both the fundamentals and the technicals saying the stock market is a risky place to be, we await its crash back to reality. Here’s why. Read More »