Remember the game Musical Chairs? It seems that investors on Wall Street have been playing this game  recently, as more and more we are seeing signs that the current bull market may be reaching its final stages. Each new sign that appears represents just one more chair being taken away from the game. The question investors need to ask is “where will I be when the music stops”?
The following article is presented by Lorimer Wilson, editor of www.munKNEE.com (Your Key to Making Money!), www.FinancialArticleSummariesToday.com (A site for sore eyes and inquisitive minds) and the FREE Market Intelligence Report newsletter (sample here; register here) and has been edited, abridged and/or reformatted (some sub-titles and bold/italics emphases) for the sake of clarity and brevity to ensure a fast and easy read. This paragraph must be included in any article re-posting to avoid copyright infringement.
Stay connected
- Subscribe to our Newsletter (register here; sample here)
- Find us on Facebook
- Follow us on Twitter (#munknee)
- Subscribe via RSS
Playing the Percentages vs. Trying to Time the Market
I’m going to use another baseball analogy to illustrate how we look at the markets. The best managers in baseball always play percentages.
- They look very carefully at the history of a particular batter, and how they are likely to fare against certain pitchers (whether that pitcher is a left-hander or right-hander).
- They also look at the frequency in which certain batters will hit the ball either to the left side or the right side of the field.
Today, baseball managers are utilizing a defensive strategy known as “the shift”; moving the infielders to the side of the field where the batter tends to hit the ball most often. Sometimes, a batter will go the opposite way, but the longer-term percentages will ultimately win out over time. If a batter usually hits to one side of the field 80% of the time, it is likely that he will continue to hit to that side of the field 8 out of 10 times. The risk…[however,] is that the batter will go to the opposite field and get a hit. That, however, will occur, at most 20% of the time, using our example above. At Altitrade Partners, we like to be on the side of winning percentages, especially when there is historical precedent to guide our decision-making.It is said that the four most dangerous words uttered by stock market investors are “It’s different this time”. We heard it in the run-up to the great technology bubble of 2000 and countless other historical stock market peaks. When this happens, it is a clear indicator to us that investors have traded a logical perspective for an emotional one. It is just one of the red flags that we look for to signal that we may be close to a market top.
We are not market-timers. In fact, we hold fast to the belief that no one can consistently call market tops and bottoms. Most of the famous market prognosticators that have had a major market call have never had another one. Just think about people like Henry Kaufman, Joe Granville, Robert Prechter and Elaine Garzarelli. All of these individuals made highly accurate, historical, market calls, but were never able to repeat the feat.
Instead of attempting to time the markets, we want to put ourselves on the side of playing the percentages. We want to position our trading accounts based on whether we believe the market is likely to head higher, or turn lower, over the next 12-18 months. I wouldn’t call it predicting as much as I would call it preparing.
At Altitrade Partners, we are preparing for a decline in the stock market based on the historical indicators that we follow, including technical data, and investor psychology.
Comparing Bull Market Returns
…Let’s get an historical perspective on the current bull market in terms of duration and return over the past five years, and compare that to other bull markets going back to 1932.
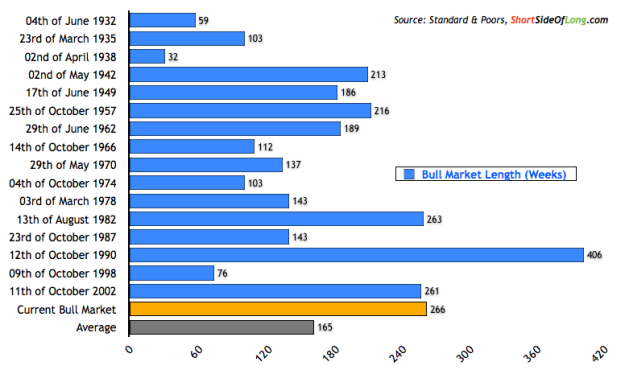
As you can see from the chart below, we are approximately 266 weeks into the current bull market, which started in 2009. The average bull market, since 1932, has lasted about 165 weeks. There has only been one other bull market that lasted longer; a record 406 weeks, beginning in October 1990.
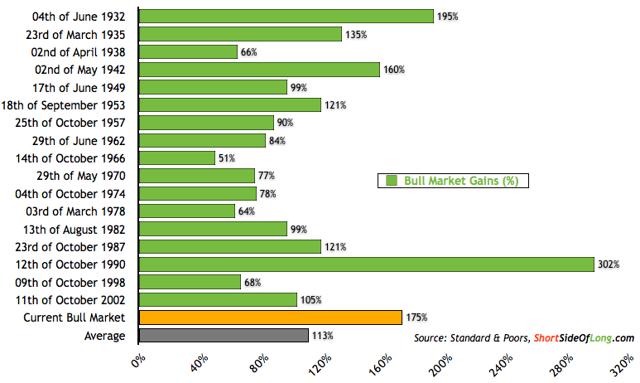
Now let’s look at the returns achieved in the current bull market cycle. Again, going back to 1932, the average bull market during the past 82 years has returned 113% to investors. The largest percentage gain was the same bull market referenced in the duration chart above, which returned a whopping 302%, followed by the 1932 bull market which returned 195% over its duration. The current bull market has returned around 175%; making it the third best overall.
To summarize; we are currently 61% above the historical average in duration for bull markets since 1932 and 55 % above the average historical return over the past 82 years.
The Volatility Index
Another important indicator is investor sentiment (one of our psychological metrics) as measured by a few different data points. First, we look at the VIX, or volatility Index. We are currently in the low 11’s. The only other times we had VIX readings this low were in 1994, 1996, 2006 and 2007. Each of these readings was then preceded by a spike in volatility, and lower stock prices.
The VIX seems to be pointing to chronic investor complacency, and a lack of respect for equity investment risk. Just one exogenous event can change all of this in a New York minute. Black swan occurrences historically have appeared when nobody expected them. The types of tail-risk events that could happen in today’s environment include:
- a China hard landing,
- a geo-political crisis in Russia or the Middle East resulting in an oil-shock similar to what we experienced in the 1970’s,
- the Federal Reserve being perceived as behind the recent pick-up in inflation and/or a gaffe in unwinding their bloated balance sheet, or even
- an unforeseen currency or sovereign banking crisis.
While all of these are long-shots, they are being discounted far too heavily by today’s investors, even to the point of a zero probability.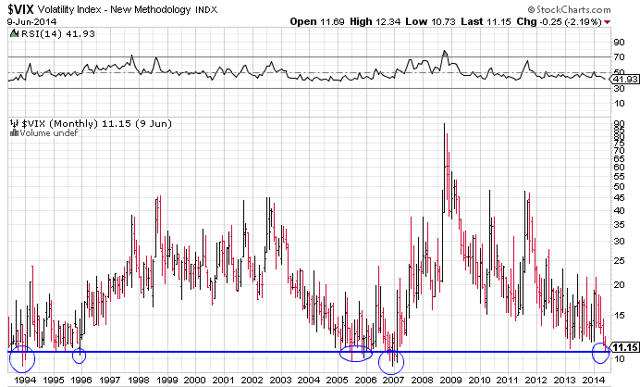
This lack of fear, coupled with excessive borrowing on margin to buy stocks, and investor willingness to reach for yield may be setting us up for the perfect storm. Add to this the fact that trading is down some 38% from levels of just four years ago, and the lack of liquidity in some areas of the market, particularly some corporate, government and municipal bonds, and you have a recipe for a potential disaster. What we may be experiencing right now is the proverbial “calm before the storm”.
One of the problems, especially during the summer months, when there is very little trading is that panic can spread like a wildfire out of control. All it takes is a few big sales in those thinly-traded securities, and prices can collapse very quickly. That is what happened last summer, when municipal bonds sellers looking to dump their holdings were hard-pressed to find any buyers for their paper. Forced-selling led to panic, and prices cratered. The flash crash of a few years ago also points to how quickly the market can experience a severe vacuum on the downside.
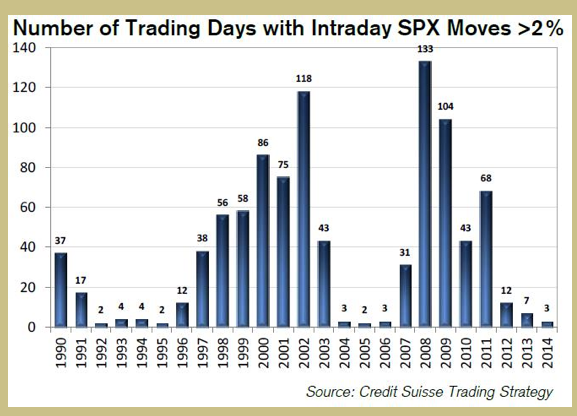
Recently, for a string of 46 days in a row, the Standard and Poor’s 500 index failed to see an intraday move of greater than 1 percent up or down; a state of serenity which we haven’t seen since 1995.
We have also been experiencing an unusually long time where the S&P 500 Index has not had an intraday move of 2% or more over the past three years. The chart below, compiled by Credit Suisse, illustrates the historical movement in the SPX over each year since 1990. We have had only 22 days over the past 3 years, when the S&P 500 moved in a range exceeding 2% for the day. After a similar lull in 2004, 2005 and 2006, volatility returned to a more normal pattern. We expect to see the same before 2014 comes to an end.
The CBOE Equity Put-Call Ratio
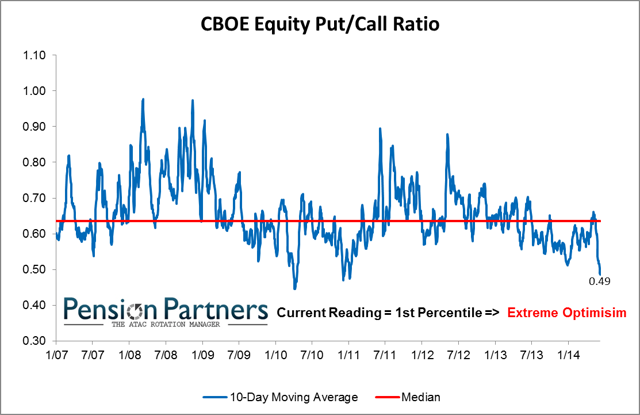
…The current CBOE Equity Put-Call Ratio…reading shows extreme optimism and recently has registered a level that is lower than 99% of its historical readings. We believe this is unsustainable for any long period of time.
VIX Seasonality
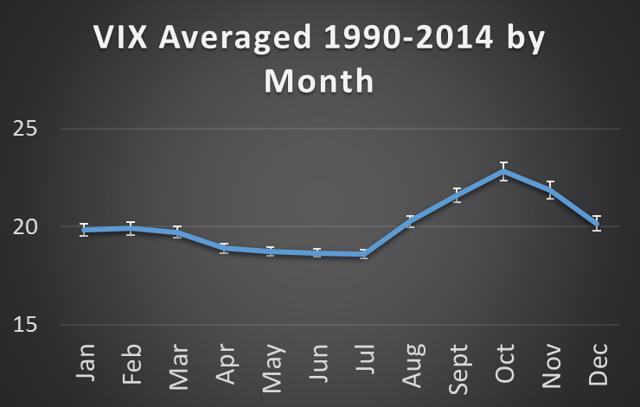
…The seasonal tendency of the VIX is to rise during the months of August, September and October -as shown in the graph below which makes for an] especially dangerous times for stocks.
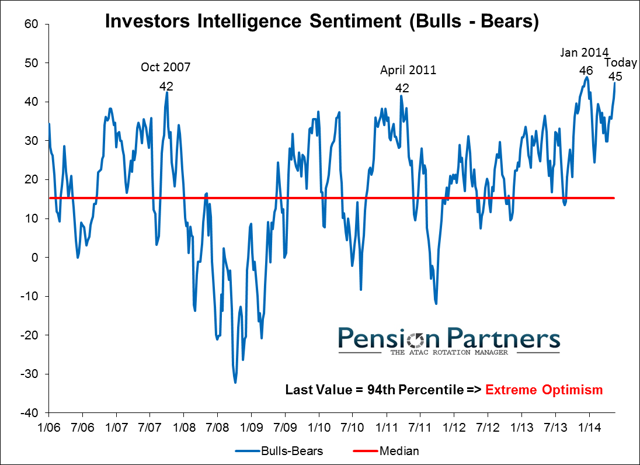
Investors Intelligence Sentiment
…The most recent Investors Intelligence numbers show an unusually high number of Bulls vs. Bears; measuring extreme optimism from an historical perspective. We use this as a contrary indicator.
Shiller CAPE (Cyclically Adjusted PE Ratio)
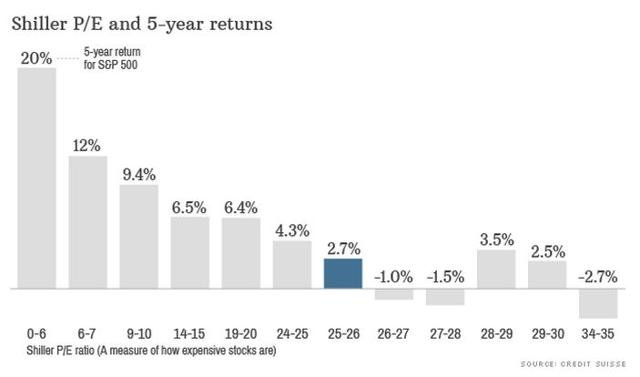
It’s not just technical and sentiment indicators that are flashing a warning sign. Some fundamental indicators are also pointing to lower equity returns in the future based on the length and breadth of the current five year bull market. For example, looking at the current Shiller CAPE (Cyclically Adjusted PE Ratio) of 25.88 against its historical mean of 16.53 and median of 15.92, it appears that returns for the S&P 500 during the next five years may be paltry.
Conclusion
While none of these indicators, in and of themselves, provide meaningful insight into where the equity markets may be heading, we believe that taken together they make a strong case for the odds of a stock market correction between now and the end of the year.
Like the baseball manager analogy, we believe that one needs to play the percentages. Based on historical data, we believe that the market will encounter significant headwinds in the not-too-distant future.
It may be time to put on “the shift” and move from an aggressive position to a more market neutral portfolio weighting, or for those investors who can take considerable risks, sell short and/or buy put options.
Remember, the key to building long-term wealth in the stock market is not to give back a significant portion of the gains made during a bull market. Protecting those gains becomes a primary goal when it appears that a regression back to historical norms is likely to result in negative returns for some period of time.
The question is, where will you be when the music stops?
Editor’s Note: The author’s views and conclusions in the above article are unaltered and no personal comments have been included to maintain the integrity of the original post. Furthermore, the views, conclusions and any recommendations offered in this article are not to be construed as an endorsement of such by the editor.
*http://seekingalpha.com/article/2292015-investors-are-playing-musical-chairs-where-will-you-be-when-the-music-stops?ifp=0 (© 2014 Seeking Alpha )
Related Articles:
1. Cycle Analysis Suggests S&P 500 Has Topped & Will Decline To Major Low In 2016
While the majority is looking at the Megaphone Pattern correction since the 2000 high and is expecting the market to go back to the lower trend line of this pattern and to make new lows, I think that it will not happen. The opinion of the majority can be used as a contrarian indicator. I think that a healthy correction in this new Secular Bull Market could push the Dow Jones to 12500-13500 (end of 2015 – half 2016) followed by a second leg up of this new Secular Bull Market. Read More »
2. Next Bear Market Shaping Up To Be Quite the Storm – Here’s Why
The U.S. stock market has been closing at one record high after another but, despite the seemingly unending investor optimism more than five years into the current bull market, some worrisome issues are continuing to build under the surface. Like all past bull markets, the latest episode will eventually come to an end and a new bear market will begin and it has the potential to be even worse than the two previous downturns since the start of the new millennium… Read More »
3. Today’s Shiller PE Suggests the Stock Market Is Overvalued By 60%!
We estimate that a ‘fair price’ for the market is a Shiller PE of around 16. With the market at close to a Shiller PE of 26, the market is overvalued by about 60%. Now is not a historically good time to initiate a position in the S&P500. Read More »
4. Fearful In This Market? If Not, You Should Be!
As Warren Buffett is famous for saying “…be fearful when others are greedy and greedy when others are fearful” and now is such a time. The crowd can be right for a long time, but they are rarely right at extremes and, while this time may be different, the probabilities suggest that at the very least it will be a more difficult environment for equities going forward. Read More »
5. Make No Mistake – A Major Stock Sell-off Looms! Here Are 4 Ominous Signs
The 4 fundamentals and technicals discussed in this article accurately called stock market crashes in 2000 and 2007 and these same market metrics are again TODAY warning that a possible financial tsunami is brewing on the horizon. No one knows for certain WHEN the tsunami will hit Wall Street…but, without question, today’s stocks exhibit extremely exaggerated valuations, and extremes never last, so make no mistake, a major stock sell-off looms. Read More »
6. EXPECT & PLAN For A Major Stock Market Correction In the Coming Weeks/Months – Here’s Why & How
The S&P 500 is now up over 180% since troughing in March 2009 and it has been almost 3 years since the stock market experienced a 10% correction. Historically, market corrections happen approximately every 2 years on average. [As such,] we think that this rally is getting very long in the tooth and we wouldn’t be surprised if we have a healthy pullback in the coming weeks or months. Read More »
7. These Indicators Should Scare the Hell Out of Anyone With A Stock Portfolio
For US stocks — and by implication most other equity markets — the danger signals are piling up to the point where a case can be made that the end is, at last, near. Take a look at these examples of indicators that should scare the hell out of anyone with a big stock portfolio. Read More »
8. This Is One “Crazy, Nastyass” Stock Market! Here’s Why
You can call this current stock market a blowoff or call it a Wile E. Coyote moment or call it a divergence or call it a disconnect or call it a lapse of judgement. You can call it whatever you want but I call it the “Honey Badger” market because this is one “crazy, nastyass” stock market – and I can’t believe I’m watching it happen all over again. Read More »
9. Bigger IS Better! What Does This Selective Advance Mean For the Stock Markets Going Forward?
The average U.S. stock is DOWN over 1% thus far in 2014. How can that be when we’re being told almost daily that the Dow and S&P 500 are hitting new all-time highs? The answer is likely to surprise you. Read More »
10. Believe It or Not: Both Bulls & Bears Playing In Current Market
The current U.S. equity market has something for everyone. Whether you are bullish or bearish, there is no shortage of indicators or charts you can use to support your thesis. Read More »
11. Are We In Phase 3 – the Final Phase – of This Bull Market Yet?
Are we in the third phase of a bull market? Most who will read this article will immediately say “no” but isn’t that what was always believed during the “mania” phase of every previous bull market cycle? With the current bull market now stretching into its sixth year; it seems appropriate to review the three very distinct phases of historical bull market cycles. Read More »
12. Is Now the Calm Before the Storm?
I’d argue that the record low volume shows investors aren’t looking ahead as much as looking behind and reminiscing at how good things have been over the past five years or so. They’re expecting more of the same even though it’s mathematically impossible people. Read More »
13. Collapse of S&P 500 May Be Only Weeks Ahead! Here’s Why
When Staple sector (i.e. defensive) stocks started to reflect greater relative strength than Discretionary sector stocks back in 2000 and again in 2007, the S&P 500 began to fall dramatically in the ensuing months. That’s happening again. Can a collapse of the S&P 500 be far behind? Read More »
14. Extreme Greed By the Crowd Suggests You Show Some Fear! Here’s Why
Greed may have been good for Gordon Gekko. but in the investment world it rarely is. As Warren Buffett is famous for saying “…be fearful when others are greedy and greedy when others are fearful” [and now is such a time]…to start showing some level of fear here in the face of extreme greed by the crowd. The crowd can be right for a long time, but they are rarely right at extremes. While this time may be different, the probabilities suggest that at the very least it will be a more difficult environment for equities going forward. Read More »
15. There’s Evidence – Plenty of It – That the Bear Is No Longer Hibernating. Here’s Why
The health of a market is best assessed along three vectors: fundamentals, technicals (price action) and sentiment and this is what each is saying about the health of the markets these days. Read More »
16. A 20%+ Sell-off is Brewing In the Lofty U.S. Stock Markets – Here’s Why & What the Future Holds
For today’s seriously overextended and overvalued US stock markets the best-case scenario is a full-blown correction approaching 20% emerging soon while the worst case is a new cyclical bear market that ultimately leads to catastrophic 50% losses. Read More »
17. Margin Debt: It Doesn’t Matter ’til It Matters! Is Now the Time to Be Worried About the S&P 500?
It doesn’t matter until it matters! IF margin debt should start decreasing swiftly, history would suggest something different is taking place in the mind of aggressive investors. Will a decline in margin debt from all-time highs matter this time? Read More »
18. A Rise In Silver Prices and a Fall In S&P 500 Index Seems Both Inevitable and Imminent – Here’s Why
Silver has had three bad years while the S&P has had 5 good years. It is time for both markets to reverse. Here’s why. Read More »
19. Is This Just a Dip Within an Ongoing Uptrend OR Have the Bears Finally Awakened?
Is the current stock market correction simply just a dip within an ongoing uptrend OR have the “bears” finally awakened from their winter hibernation? [Below are my views on the subject plus those of several others to help you arrive at an informed conclusion]. Read More »
20. Stock Market Will Collapse In May Followed By Major Spike in Gold & Silver Prices! Here’s Why
The unintended consequences of five years of QE are coming home to roost! In May or early June the stock market parabola will collapse…followed by a massive inflationary spike in commodity prices – particularly gold & silver – that will collapse the global economy. Read More »
21. 2 Stock Market Indicators Are Saying “Be careful, don’t get caught up in the euphoria”
In the midst of all the optimism we see towards key stock indices these days, there are two leading indicators that are flashing warning signals. They say, “Be careful, and don’t get caught up in the euphoria.” Read More »
22. Are Stock Market & U.S. Dollar About to Crash? Will Gold Be the Major Benefactor?
Something is clearly out of whack. Gold has failed to push higher against the backdrop of a lower U.S. dollar for the first time in over a decade and, with pressure on the dollar increasing, the failure of support could ignite a massive decline. Is gold preparing to launch this time? Read More »
23. Beginnings of Massive Stock Market Correction Developing: Don’t Delay, Prepare Today!
No stock can resist gravity forever. What goes up must eventually come down. This is especially true for stock prices that become grotesquely distorted. We have been – and still are – living in another dotcom bubble, and – like the last one – it is inevitable that it is going to burst. Read More »
24. 3 Historically Proven Market Indicators Warn of an Impending Market Top
It’s frustrating to see key stock indices keep pushing higher when historically proven market indicators are all warning of a crash ahead. Irrationality is exuberant to say the very least, and that’s why I believe this rally is counting its last days. Read More »
25. Time the Market With These Market Strength & Volatility Indicators
There are many indicators available that provide information on stock and index movement to help you time the market and make money. Market strength and volatility are two such categories of indicators and a description of six of them are described in this “cut and save” article. Read on! Words: 974 Read More »
26. The Stock Market Is a Risky Place to Be – Here’s Why
With both the fundamentals and the technicals saying the stock market is a risky place to be, we await its crash back to reality. Here’s why. Read More »
27. We’re on the Precipice of a 50% Drop in the U. S. Stock Market! Here’s Why
Warren Buffett’s favorite indicator – the ratio of the value of U.S. stocks to GDP – is seen by him as a reliable gauge of where the market stands and these days it suggests that all the main indexes are pointing to an imminent 50% crash. Read More »
28. These Indicators Suggest Stock Market Returns Are “Too Good To Be True”
Current macro conditions indicate that we are in a sweet spot for equity returns…that global growth is continuing and there is little or no tail risk in the immediate future. It’s time to get long equities…but I have this nagging feeling that these market conditions are too good to be true. If you look, there are a number of technical and fundamental clouds on the horizon. Read More »
29. Bookmark This Article: The Stock Market Will Crash Within 6 Months!
Until recently, I have not used the term “stock market crash”. I do not take using this term lightly. It brings with it major repercussions. I am now breaking out this phrase because of the current state of the stock market. This stock market crash will occur within the next six months from today… The markets will fall within a combined day/few days a total of at least 20%. Bookmark this article. Read More »
 munKNEE.com Your Key to Making Money
