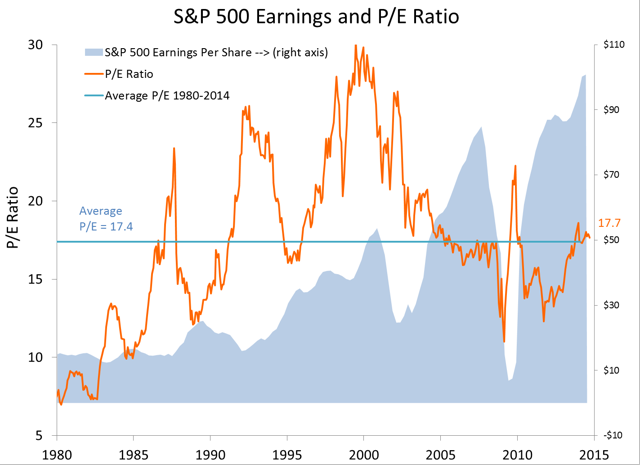
The S&P 500 has rallied for three years in a row, without a significant correction. This  puzzles many observers who consider equities to be overvalued. Many experts predicted a correction (or worse) this year – after predicting one last year which has not happened – so how high is the S&P 500 valuation, after all?
The following article is presented by Lorimer Wilson, editor of www.munKNEE.com (Your Key to Making Money!), www.FinancialArticleSummariesToday.com (A site for sore eyes and inquisitive minds) and the FREE Market Intelligence Report newsletter (register here; sample here). This paragraph must be included in any article re-posting to avoid copyright infringement.
- The P/E Ratio: Its Strengths and Limitations
- Be Careful: The P/E Ratio Can Steer You into a Financial Disaster
(click to enlarge) Source: Standard & Poor’s, author’s calculation
We can also see that:
- The P/E ratio was generally lower in the 1980’s than today’s P/E of 17.7
- It was generally higher in the 1990’s than today
- Today’s P/E is close to the average in the past 10 years.
Conclusion
…While data may change at any time, our models expect strength in U.S. equities, [and that of the S&P 500, in particular,] to continue.
We recommend that tactically-minded investors:
- overweight U.S. equities and underweight bonds…[and]
- allocate the maximum amount allowed by an investor’s risk tolerance (or institution’s investment policy) to core large-cap U.S. equities.
Editor’s Note: The author’s views and conclusions in the above article are unaltered and no personal comments have been included to maintain the integrity of the original post. Furthermore, the views, conclusions and any recommendations offered in this article are not to be construed as an endorsement of such by the editor.
*http://modelcapitalmgmt.com/how-high-is-equity-valuation/ (© 2014 Model Capital Management LLC. All rights reserved.)
If you liked this article then “Follow the munKNEE” & get each new post via
- Our Newsletter (sample here)
- Twitter (#munknee)
Related Articles:
1. The P/E Ratio: Its Strengths and Limitations
When it comes to valuing stocks, the price-to-earnings (P/E) ratio is the number one metric for investors that want an instant fix on what the market thinks of a company. [That being said]…there are health warnings to heed if you don’t want to be left exposed by its limitations. [Let me explain.] Words: 1101 Read More »
2. Be Careful: The P/E Ratio Can Steer You into a Financial Disaster
There’s no doubt that p/e ratios are an important part of many investors’ decision making but relying too heavily on these financial ratios can expose you to serious risk. Successful investors treat p/e’s as just one of many tools, and not a deciding factor. Words: 503 Read More »
3. Markets & Economy NOT Topping Out & Ready to Roll Over – Here’s Why
Sure, the market is getting more and more expensive, debt levels are still high around the globe, and the Drudge Report assures us daily that the world is going to hell in a handbasket, but does this signal the end is near for stocks and the economy? This article presents 4 “big picture” charts or indicators to help determine whether the markets and economy are topping out and ready to roll over. Let’s take a look. Read More »
4. These 6 Indicators Reveal A Great Deal About Market’s “Upside” Potential
Trying to predict markets more than a couple of days into the future is nothing more than a “wild ass guess” at best but, that being said, we can make some reasonable assumptions about potential outcomes based on our extensive analysis of these 6 specific price trend and momentum indicators. Read More »
5. Call the “Smart Money’s” Bluff & Stay Invested – Here’s Why
Brace yourself! The stock market is ripe for a nasty selloff according to a number of politicians and even more market pundits – but not so fast. Two very reliable long-term recession indicators strongly suggest that a correction – or worse, the end of the bull market – is highly unlikely given the current state of the economy. Let me explain. Read More »
6. Mixed Signals About Direction of Stock Market Abound – Here Are 10
[No wonder you are confused!] Several technical and fundamental indicators have flashed caution to no avail and this has given way to an uncomfortable tension beneath the surface as investors try to find answers while keeping pace with performance. Below are 10 mixed signals about the near-term direction and theme of the markets. Read More »7. What Are the 2 Catalysts That Cause Major Market Corrections Telling Us Today?
There are a number of potential pitfalls out there for the market but, right now, the behavior of the main catalysts for a major correction suggest that there continues to be more right than wrong with the market. Let me explain. Read More »
8. A Stock Market Correction/Crash May Not Occur For Quite A While – Here’s Why
Some investors are sure we’re heading for a crash because we’ve had such an uninterrupted rise in stocks but these things can last much longer than most people realize. While a crash is never out of the realm of possibilities, just because stocks are up doesn’t mean they have to immediately crash. Eventually they will be right. It’s the timing that gets you on these type of calls. Read More »
 munKNEE.com Your Key to Making Money


