A major sell-off is brewing in the lofty US stock markets, which have been grinding sideways for a couple months now…Stocks remain very overvalued – way too expensive for prudent investors to buy… [In addition,] it’s been far too long since their last necessary and healthy correction to re-balance sentiment, so one is seriously overdue.
The above are edited excerpts from an article* by Adam Hamilton (zealllc.com) entitled Major Stock Selloff Looms.
The following article is presented by Lorimer Wilson, editor of www.munKNEE.com (Your Key to Making Money!), and the FREE Market Intelligence Report newsletter (sample here; register here) and has been edited, abridged and/or reformatted (some sub-titles and bold/italics emphases) for the sake of clarity and brevity to ensure a fast and easy read. This paragraph must be included in any article re-posting to avoid copyright infringement.
Hamilton goes on to say in further edited excerpts:
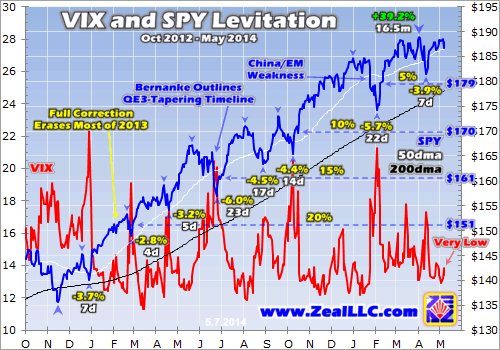
“Last year’s extraordinary stock-market levitation has run out of steam. In the 16.5 months leading into April 2014, the flagship S&P 500 stock index blasted 39.2% higher! Capital indiscriminately flooded into stocks regardless of fundamentals or valuations because the Federal Reserve was doing its darnedest to convince traders that it was effectively backstopping the stock markets. This bred extreme complacency.
Top Fed officials including Ben Bernanke and now Janet Yellen kept implying that the Fed was ready to…[speed] up its monetary printing presses to arrest any meaningful stock-market sell-off so traders greedily bought stocks, ignoring all normal stock-market-topping warning signs. In the past couple months, however, this buying has largely vanished. While the S&P 500 has stalled, hyper-overvalued momentum stocks are crumbling, and these growing fissures in the stock markets are on the verge of splitting wide open to shake everything.
This first chart looks at the S&P 500’s extraordinary Fed-driven levitation over the past year and a half, seen through the lens of the mighty SPDR S&P 500 ETF (SPY). Not only is the stock markets’ recent stalling out very apparent, but so is the lack of serious sell-offs over this time span. If this beloved stock bull is going to even have a chance of continuing higher, it absolutely needs to see a large correction soon.

…As April waned after the great bulk of the elite S&P 500 component companies had reported their first-quarter profits, that index still traded at incredibly high valuations. On balance corporate earnings barely grew, leaving market price-to-earnings ratios extremely expensive.
- On a trailing-twelve-month basis, the average P/Es of the S&P 500 component stocks were running at 22.6x when weighted by their market capitalizations and 25.9x in simple-average terms…comparing to the century-and-a-quarter fair value in the U.S. stock markets of 14x! (21x marks expensive levels, when stocks rarely enjoy positive returns in the coming years, and over 28x is actually bubble territory.)
These exceedingly-risky overvaluations exist at a time when the U.S. stock markets have gone far longer than normal without a 10%+ correction to re-balance sentiment. On average, in healthy bulls, these come on the order of once a year or so. The longer stocks advance without some serious selling to slice away the excessive greed and complacency that rising markets breed, the greater the odds of an imminent major sell-off.
In broad stock-market terms, sell-offs are stratified by magnitude. Anything under 4% on the S&P 500 or SPY doesn’t even have a name, it is just normal volatility. Over 4% and sell-offs are classified as formal pullbacks. We’ve seen four of these over the past year and a half or so, but all have been minor.
The efficacy of sell-offs for re-balancing sentiment is directly proportional to their size. Big pullbacks approach 10%, at which point they become full-blown corrections….When stocks do nothing but rise (like the 39.2% they did in the last 16.5 months without even a hint of a correction-magnitude sell-off) investors quickly forget about their inherent riskiness so greed and complacency grow out of control, threatening to choke off the bull.
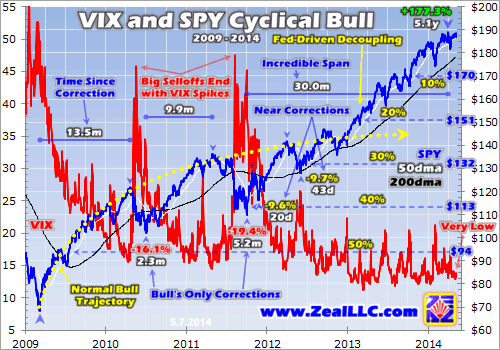
As the next chart reveals, it has actually been a truly mind-boggling 30 months since the end of the last S&P 500 correction! It ended way back in early October 2011. Since then SPY has blasted 71.8% higher at best, with no check on increasingly rampant greedy sentiment. In a normal healthy bull market, we would have seen two or three correction-magnitude selloffs during that time to keep psychology in line.
The problem with excessive greed is it foments major market toppings, bull-slaying events. Greed sucks in all available buying, burning itself out and leaving a vacuum that selling fills…. Greed’s polar opposite is fear and stock market fear is beautifully approximated by the famous VIX implied volatility index.
While VIX technically looks at evolving S&P 500 index-options pricing, it effectively measures sentiment. Greed and fear are very asymmetric emotions. Greed builds gradually while fear flares rapidly so a high VIX shows the widespread fear seen at major stock-market lows, and a low VIX shows the absence of fear….
Today’s VIX is very low, still down in the 13s this week which is topping territory in historical context. Given this, the rampant overvaluations, and the extraordinarily long time since the last correction, there is zero doubt a correction-magnitude sell-off is looming.

Selling and fear feed on themselves, forming a powerful vicious circle. Traders sell, so stocks fall, so fear and bearishness grows, so still more traders sell, and stocks go lower and this cycle keeps renewing itself…[As such,] given:
- today’s epic greed and euphoria,
- last year’s wildly-anomalous Fed-driven stock levitation, and
- the super-excessive span since the last full-blown correction,
I can’t imagine the expected necessary correction to re-balance sentiment stopping at 10%. Frankly, even a 15% sell-off [would be] pretty mild after such an abnormal span without corrections, so the odds wildly favor a large specimen approaching 20%. Heck, this cyclical bull’s past two corrections, which didn’t occur in euphoric extremely overbought stock markets, ran 16.1% and 19.4% in SPY terms. A totally healthy full-magnitude 20% correction would crush SPY back down near $151. Look at how low that is in the chart above!
20% Sell-off
If today’s cyclical stock bull can stay alive, 20% is certainly enough. Greed would be largely eradicated, with fear and the VIX very high but, because of today’s extraordinary situation, the future viability of this massive bull market is seriously in question [because:]
- thanks to the Fed’s manipulations, this stock market bull soared 177.3% between March 2009 and April of 2014 which makes today’s bull far older and bigger than normal – far beyond the normal averages of a doubling in just under 3 years.
- On top of that we have today’s extreme stock-market valuations between 23x to 26x earnings depending on the averaging of the S&P 500 components’ individual trailing P/Es. These historically expensive valuations approaching bubble territory coupled with a geriatric bull really challenge the notion that a 20% selloff would be enough.
Any sell-off over 20% in the S&P 500 is formally classified as a bear and these rarely stop near 20%. At our current stage in the great third-of-a-century Long Valuation Wave bull-bear cycles, cyclical bears tend to cut stock prices in half. That’s right, 50% peak-to-trough declines! This next chart zooms out a bit to show SPY’s current massive cyclical bull, and the brutal implications of a new bear market for stocks.

30% Sell-off
A 30% decline is mild as far as stock bears go, too common to get excited about and, after SPY rocketed 29.7% higher last year alone thanks to the Fed’s money printing and jawboning, a mild bear certainly seems reasonable to re-balance sentiment. A 30% decline would crush SPY down near $132 [see chart above], taking it to levels last seen in mid-2012 and first seen way back in early 2011. Literally years of bull would be wiped out!
40% Sell-off
A 40% peak-to-trough sell-off would leave SPY just above $113, and as you can see that was last seen near the bottom of this bull’s last correction in mid-2011 and first seen in early 2010.
50% Sell-off
Corrections normally take a few months, not enough time for corporate earnings to materially grow so, were the overdue correction to materialize soon and the S&P 500 were to go down by 20% a few months from now, valuations would still be between 18x and 21x, and 21x is expensive historically…[As such,] powerful arguments can be advanced that instead of a mere bull-market correction, we are now experiencing a bull-market topping that is going to lead to a new cyclical bear market in stocks.
A garden-variety cyclical stock bear which cuts stocks in half would leave SPY devastated near $94, levels last seen in mid-2009. A normal full-blown stock bear would eliminate nearly this entire bull run in a couple years!…This is why it is so unforgivably foolish to be greedy and euphoric when topping signs abound, to buy stocks high rather than buying stocks low. The stock markets are forever cyclical, and investors who naively or brazenly buy into a topping just get slaughtered.
If there is a good chance for a new bear, and there is a high chance right now, it makes no sense at all to buy the vast majority of stocks. It takes many years to recover from 50% losses and we mortal humans generally only have a few decades of earnings from which to divert surpluses to invest so the setback from a bear is devastating – and their psychological impact is so great bears force many weaker traders out of stocks forever.
Conclusion
For today’s seriously overextended and overvalued U.S. stock markets,
- the best-case scenario is a full-blown correction approaching 20% emerging soon.
- the worst case is a new cyclical bear market that ultimately leads to catastrophic 50% losses.
Prudent investors need to be exceptionally careful today, ready to pull out. With this bull running out of steam in recent months despite good news, a topping is likely underway.”
Editor’s Note: The author’s views and conclusions in the above article are unaltered and no personal comments have been included to maintain the integrity of the original post. Furthermore, the views, conclusions and any recommendations offered in this article are not to be construed as an endorsement of such by the editor.
*http://zealllc.com/2014/spysell.htm (© Copyright 2000-2014 Zeal LLC All rights reserved)
Remember: If you like what you read above please sign up to receive our 2-3 times a week “Market Intelligence Report” containing introductions to every new article/video that has just been posted on the site. If you are not inclined to subscribe to newsletters then please “Follow the munKNEE” via Facebook or twitter for direct access to every new article and/or video posted.
Related Articles:
1. A Rise In Silver Prices and a Fall In S&P 500 Index Seems Both Inevitable and Imminent – Here’s Why
Silver has had three bad years while the S&P has had 5 good years. It is time for both markets to reverse. Here’s why. Read More »
Last year’s “Sell in May” period was only the third time since the turn of the century that stocks have postedstockcrash-2 double-digit gains from May through October so, with stocks still near all-time highs as the calendar flips to May, do the law of averages suggest we’re on the brink of a major pullback over the next six months? Read More »
3. 2 Stock Market Indicators Are Saying “Be careful, don’t get caught up in the euphoria”
In the midst of all the optimism we see towards key stock indices these days, there are two leading indicators that are flashing warning signals. They say, “Be careful, and don’t get caught up in the euphoria.” Read More »
4. Are Stock Market & U.S. Dollar About to Crash? Will Gold Be the Major Benefactor?
Something is clearly out of whack. Gold has failed to push higher against the backdrop of a lower U.S. dollar for the first time in over a decade and, with pressure on the dollar increasing, the failure of support could ignite a massive decline. Is gold preparing to launch this time? Read More »
5. Beginnings of Massive Stock Market Correction Developing: Don’t Delay, Prepare Today!
No stock can resist gravity forever. What goes up must eventually come down. This is especially true for stock prices that become grotesquely distorted. We have been – and still are – living in another dotcom bubble, and – like the last one – it is inevitable that it is going to burst. Read More »
6. Stock Market Will Collapse In May Followed By Major Spike in Gold & Silver Prices! Here’s Why
The unintended consequences of five years of QE are coming home to roost! In May or early June the stock market parabola will collapse…followed by a massive inflationary spike in commodity prices – particularly gold & silver – that will collapse the global economy. Read More »
7. 3 Historically Proven Market Indicators Warn of an Impending Market Top
It’s frustrating to see key stock indices keep pushing higher when historically proven market indicators are all warning of a crash ahead. Irrationality is exuberant to say the very least, and that’s why I believe this rally is counting its last days. Read More »
8. Time the Market With These Market Strength & Volatility Indicators
There are many indicators available that provide information on stock and index movement to help you time the market and make money. Market strength and volatility are two such categories of indicators and a description of six of them are described in this “cut and save” article. Read on! Words: 974 Read More »
With both the fundamentals and the technicals saying the stock market is a risky place to be, we await its crash back to reality. Here’s why. Read More »
10. We’re on the Precipice of a 50% Drop in the U. S. Stock Market! Here’s Why
Warren Buffett’s favorite indicator – the ratio of the value of U.S. stocks to GDP – is seen by him as a reliable gauge of where the market stands and these days it suggests that all the main indexes are pointing to an imminent 50% crash. Read More »
11. End of “Wall Street Party” Will Be a Catastrophe! Here’s Why
The markets are considerably, fantastically overbought and that whatever happens after this “Wall Street Party” is going to be a sort of catastrophe. Here’s why. Read More »
12. Stock Market Bubble Going to Burst & Unleash Destructive Forces on Global Economy
The Fed has manufactured a parabolic move in the stock market…which is much more aggressive (and thus even more unsustainable) than witnessed at either the 2000 or 2007 stock market tops. Parabolas always collapse – there are never any exceptions – so when the pin finds this bubble it’s going to take down not only our stock market, but unleash a destructive force on the global economy. Read More »
 munKNEE.com Your Key to Making Money


