Virtually everyone has become convinced that the dollar is going to 110, 120 or even 160. Folks when everyone is thinking the same thing … then no one is thinking. Here’s the thing. Almost no one is prepared for the dollar to drop. Everyone is convinced the dollar is going higher, and everyone is positioned long. Everyone is on the same side of the boat. When that happens invariably the boat tips over so here’s what I think is going to happen.
The above comments, and those below, have been edited by Lorimer Wilson, editor of munKNEE.com (Your Key to Making Money!) and the FREE Market Intelligence Report newsletter (see sample here – register here) for the sake of clarity ([ ]) and brevity (…) to provide a fast and easy read. The contents of this post have been excerpted from an article* by Gary Savage (blog.smartmoneytrackerpremium.com/) originally entitled The Most Lopsided Trade and which can be read in its unabridged format HERE. (This paragraph must be included in any article re-posting to avoid copyright infringement.)
Let’s take a look at this “one way” trade.
The U.S. Dollar Index
1. USD
If the dollar is going higher then it goes without saying that it should continue to make higher highs and higher lows. That is the definition of a rising market but last month the dollar not only broke the triangle consolidation pattern, it dropped below the intermediate cycle low in May. That is a failed intermediate cycle – and failed intermediate cycles generally only occur when the larger multi-year cycle is in decline.
Next let’s look at the two largest weighted currencies that make up the dollar index, the euro and yen.
2. The Euro
For a currency that we’ve been told is going back to par, I have to wonder why it’s making higher intermediate highs & higher lows, regained the 200 day moving average, and broken the year long down trend line.
3. The Yen
The same thing is manifesting in the yen. A major multi-year down trend line has been broken and the 200 DMA recovered.
If these two currencies are bottoming then the dollar is topping.
4. The U.S. Dollar Index Trend
Next let’s look at a long term chart of the dollar. At the recent peak earlier this year the dollar had retraced almost 62% of the previous bear market. The bull in the 90’s retraced about 50% of the previous bear before rolling over.
This bull is almost 8 years old and it may very well be time for the next bear market to begin.
5. The U.S. Dollar Cycle
Now let’s go back and take a closer look at the dollar cycle. First note that the last intermediate cycle low occurred in May. The most recent low occurred in August on week 15. Week 15 is generally too early for a final intermediate cycle low. They usually take 20-25 weeks before bottoming. Also note that the dollar has not been able to recover the 10 week moving average.
This is suggesting that the dollar isn’t done going down yet. It should have at least one more smaller daily cycle down before the larger intermediate cycle bottoms.
6. Daily U.S. Dollar Charts
A look at the daily charts below show that indeed the current daily cycle appears to have topped on day 8 having failed multiple times to regain the 50 DMA. A top on day 8 indicates a left translated cycle is now in progress. Left translated cycles almost always drop below the previous cycle low meaning that the dollar is now highly likely to fall below the August lows.
As mentioned previously, almost no one is prepared for the dollar to drop. Everyone is convinced the dollar is going higher, and everyone is positioned long.
Everyone is on the same side of the boat. When that happens invariably the boat tips over so here’s what I think is going to happen:
- the dollar is going to continue down in this left translated cycle,
- at some point its going to break through that August low, then
- the currency markets are going to panic because no one is prepared for the dollar to drop which will trigger
- a waterfall decline that will at the very least test the breakout at 88-89 – but it may be worse…
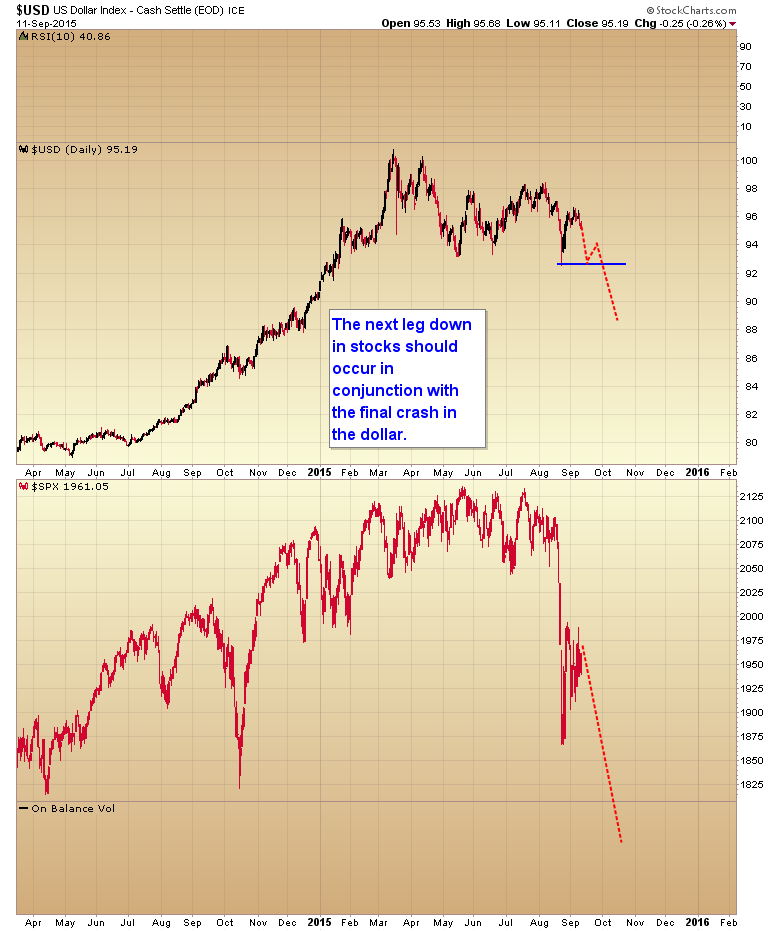
7. U.S. Dollar and S&P 500 Charts
As I have noted before intermediate cycle lows in stocks almost always correspond with either a top in the dollar cycle or a bottom, then we can probably assume that the final 7 YCL in the stock market is going to occur in conjunction with the crash in the dollar.
As the Fed continues to intervene in the markets they are virtually guaranteeing there will be a second crash in October. I’ve said all along that all the interventions this year to prop up the stock market would just cause a crash, and sure enough that is exactly what has happened. They haven’t learned their lesson and further interventions will just exacerbate the next leg down.
If the second leg down is as large as I think it will be (possibly testing 1550 on the S&P) then the dollar may not stop at 88-89, but could drop to the next support zone (85) in an all out panic.
8. CRB & Gold Charts
Now you see why I think that commodities may have found their 3 year cycle low.
The next leg of the commodity bull market was never going to be driven by fundamental supply and demand – it was always going to be driven by the currency markets – so it makes no difference if there is an oversupply of oil. All that matters in the years ahead is that there will be an even bigger oversupply of global currency units.
While all commodities should benefit, gold and silver should benefit the most, and the mining stocks are now in position to generate one of the largest bull markets in history. Remember, the larger the bear market, the larger the bull market that follows. The juniors are down 90% and the majors 84%. Without a doubt this has been one of the most destructive bear markets in history. It’s going to spawn one of the largest bull markets any of us will ever see.
*http://news.goldseek.com/GoldSeek/1442236200.php
Related Articles from the munKNEE Vault:
1. Here’s Why the U.S. Dollar Is Going Through the Roof
When markets expect that U.S. interest rates will be hiked, it typically strengthens the dollar because people rush to change other currencies into dollars where they can make more money and this higher demand for the USD drives its value up.
2. 3 Reasons To Expect An Even Stronger U.S. Dollar
Where will the dollar go from here? My answer: Though currency market volatility is likely to continue, I still see a stronger dollar over the longer term. Here’s why:
3. Gold’s Price Is Mostly Affected By These Macroeconomic Factors
For relevant analysis of gold prices, the so-called “fundamentals” provide scant help. What is required is an understanding of the macroeconomic drivers at play. This article addresses 9 such factors.
4. Current Gold-to-S&P 500 Ratio Suggests Major Upward Move Coming In Gold Price
Central banks clearly want inflation and fear deflation and will, therefore, find a way to create the inflation they want resulting in gold prices somewhere between $3,000 and $4,500 by 2025.