The market’s history often provides clues to its future – we’re big fans of precedent analysis – so now’s a good time to delve into prior, similar instances to see what they led to [and, therefore, what we might expect in the next 2 months].
The above comments, and those below, have been edited by Lorimer Wilson, editor of munKNEE.com (Your Key to Making Money!) and the FREE Market Intelligence Report newsletter (see sample here – register here) for the sake of clarity ([ ]) and brevity (…) to provide a fast and easy read. The contents of this post have been excerpted from an article* by cabot.net originally posted on SeekingAlpha.com under the title Market Meltdown: History Tells Us What To Expect and which can be read in its unabridged format HERE. (This paragraph must be included in any article re-posting to avoid copyright infringement.)
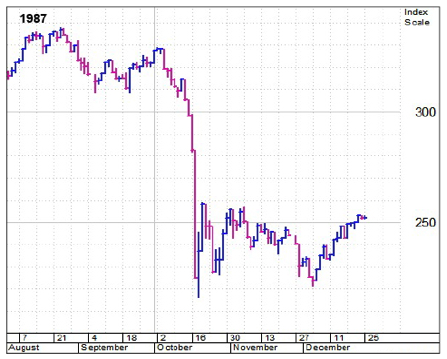
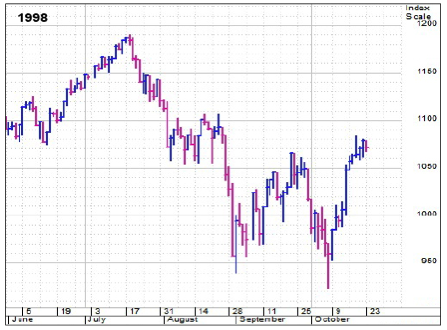
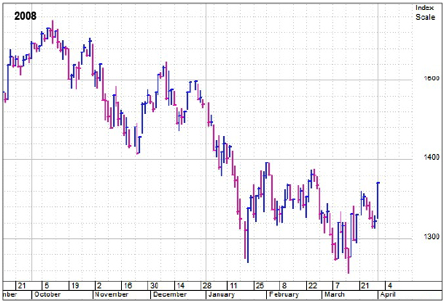
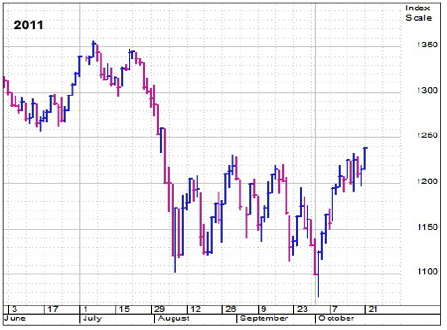
The past 4 market “shocks” (huge declines soon after a market top, with the decline coming within just a couple of weeks) look similar to what’s happened in recent weeks, as follows:
1. The decline in 1987 (see chart below) was much more extreme [than the current one] but we’re interested in the action after that. Measuring the recovery in the days after the crash, we see that:
- the S&P 500 recovered nearly 40% of its decline over 14 trading days before backing off and retesting its lows.
- The retest produced some positive divergences (290 new lows versus 1,175 new lows during the crash) and came 6.5 weeks later.

2. In 1998, when the Russian ruble crisis and the implosion of Long Term Capital Management crushed the market in July and August,we see that:
- the rally after the low recouped almost exactly 50% of the crash phase over three weeks (16 trading days) and
- a successful retest (933 new lows vs. 1,190 new lows at the first low) came 5.5 weeks after the initial low.

3. In the spring of 2008, which wasn’t the ultimate bottom to that year’s bear market but did lead to a few months of upside…:
- the initial rally only lasted 8 days before topping out, but it did make back 50% of the decline, and
- led to a retest 7.5 weeks after the first low.

4. In the 2011 plunge, brought on by the first European debt crisis (and U.S. debt ceiling battle)…:
- the S&P regained 50% of the July and August losses in 17 trading days, and then
- retested its lows 8 weeks later.

Summary
Putting them together, we see that the rebounds from these shocks tend to:
- gain back around half of the decline,
- last 2-4 weeks and then
- lead to a retest about 6-8 weeks after the first low.
Conclusion
Given the extreme panic readings seen last week (1,336 new lows on Monday, a spike in the VIX above 50) however, and the speed of the decline (45% of the losses in one week), this environment bears a lot of resemblance to the 4 above mentioned “shocks.”
Therefore, if history plays out, stocks will poke higher for another week or two before heading south and retesting last week’s bottom some time in October.
*http://seekingalpha.com/article/3492646-market-meltdown-history-tells-us-what-to-expect?ifp=0
Related Articles from the munKNEE Vault:
1. The Next “Shemitah” Occurs on Sept. 13th – Be Ready This Time
On the very last day of the last two Shemitah years, the stock market crashed so badly that it set a brand new all-time record and now we are in another Shemitah year. It began last fall, and it will end next September. Could it be possible that we will see another historic market crash?
2. The Stock Market Crash Season Is Here & Here’s What the Future Holds
Where do we go from here? I can promise you, it’s only going to get worse! Like our economy, there is clear seasonality when it comes to stocks. Trends flesh out overtime. It’s not random. From that data, I want to give you a picture of what the next few months might look like.
3. S&P 500 Likely To Decline A Further 10-30% Over The Next Year – Here’s Why
Over the last week, the S&P 500 has been decimated…and decades of financial data suggest that further downside is entirely likely…anywhere from 10-30% is over the next year. Here’s why.
4. September To Bring Stock Market Crash & Beginning Of Economic Depression
We are now on HIGH ALERT!!!!! Grand Supercycle degree wave (IV)’s decline could start soon. We need to pay close attention and be prepared for a September 2015 event that triggers a stock market crash and economic depression.
5. Trying to Time the Market Is a Fool’s Errand – Here’s Proof
Pullbacks happen, and usually the market recovers, so trying to time the market is probably a fool’s errand – and a money loser.
6. Hang In There! Panic Selling Is A Failing Strategy – Here’s Proof
Successful investors outperform by being patient and riding out the volatility. Losers panic and sell at what might appear to be the beginning of downturns. Losers make the mistake of thinking they can predict what will happen next and unsuccessfully time the market. Here’s proof that Panic Selling Is A Failing Strategy.
7. Predicting What the Stock Market Will Do Is Impossible – Here’s More Proof
Predicting what the stock market will do in the next 12 months is tantamount to predicting coin flips. Here’s more proof that past stock market performance tells you nothing about future results — literally nothing.
 munKNEE.com Your Key to Making Money