The media is full of stories claiming that lower tax rates will cause a huge and damaging increase in the federal deficit and will fail to stimulate the economy. Here are some charts which show that those claims are not backed by historical experience…
 This article is an edited ([ ]) and revised (…) version of an article by Scott Grannis to ensure a faster & easier read. It may be re-posted as long as it includes a hyperlink back to this revised version to avoid copyright infringement.
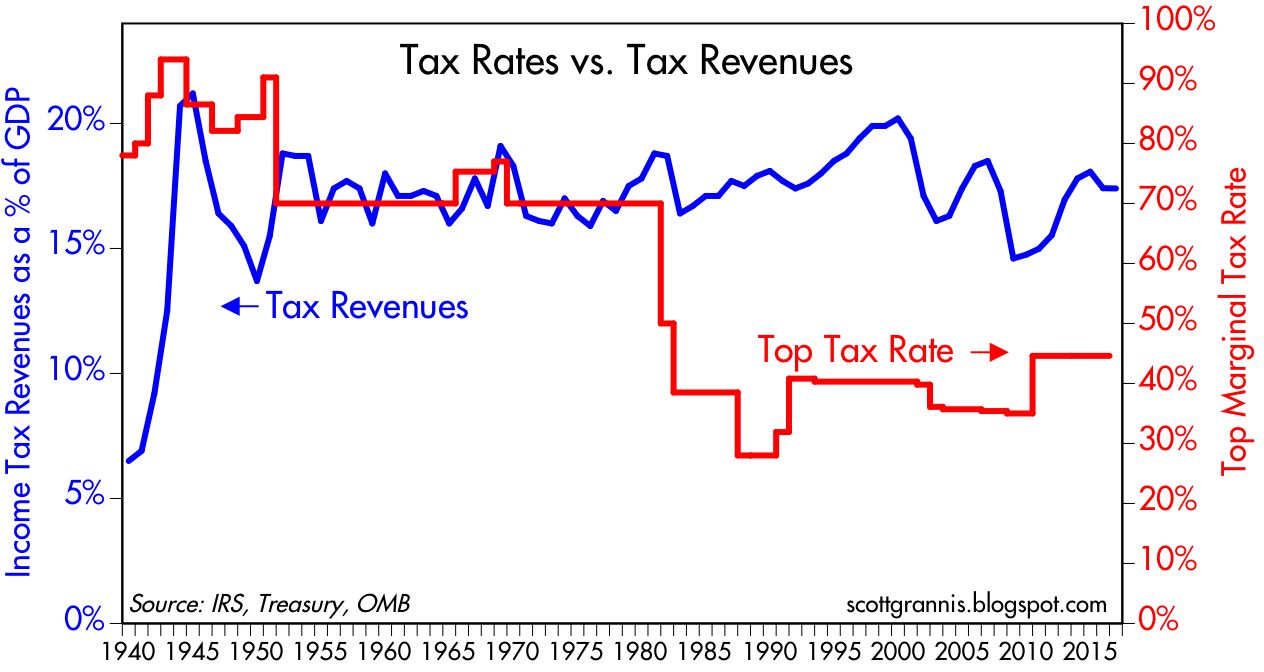
Lower Tax Rates DO NOT Affect Tax Revenues As a % of GDP)
The chart below compares top tax rates to tax revenues as a % of GDP. (Comparing taxes collected to the size of the economy is the only meaningful measure of revenues.) Note that despite the huge reduction in tax rates in the early years of the Reagan administration (early 80s), revenues hardly fell at all, and in fact increased at a fairly impressive rate through the late 80s and 90s.
Rising Federal Budget Deficits Has NO Impact On Interest Rates
As the chart above shows, there is not a shred of evidence to suggest that rising federal budget deficits have any impact significant impact on interest rates. Huge increases in the budget deficit have occurred alongside very low interest rates. Predicting higher interest rates as a result of rising deficits is not supported by the experience of the past.

Federal Revenue Goes UP & Down Depending On Economic Growth or Decline
As the chart below shows, recessions almost always result in very weak tax collections. No surprise: recessions cause incomes and employment to fall; the tax base shrinks and revenues decline. Periods of economic growth almost always cause revenues to rise.

Federal Spending Almost Always Rises As a Result of Recessions
As the chart below shows, federal spending almost always rises as a result of recessions. Politicians can’t resist spending extra money to “stimulate” the economy, and automatic stabilizers like food stamps and unemployment insurance kick in. The most important influence on revenues and spending is the health of the economy.

Tax Cuts DO NOT Worsen the Deficit
The Reagan tax cuts did little if anything to worsen the deficit, which began rising in the wake of the recessions of ’81 and ’82. As the chart below shows, the current deficit, relative to GDP, is well within the range of post-war experience.

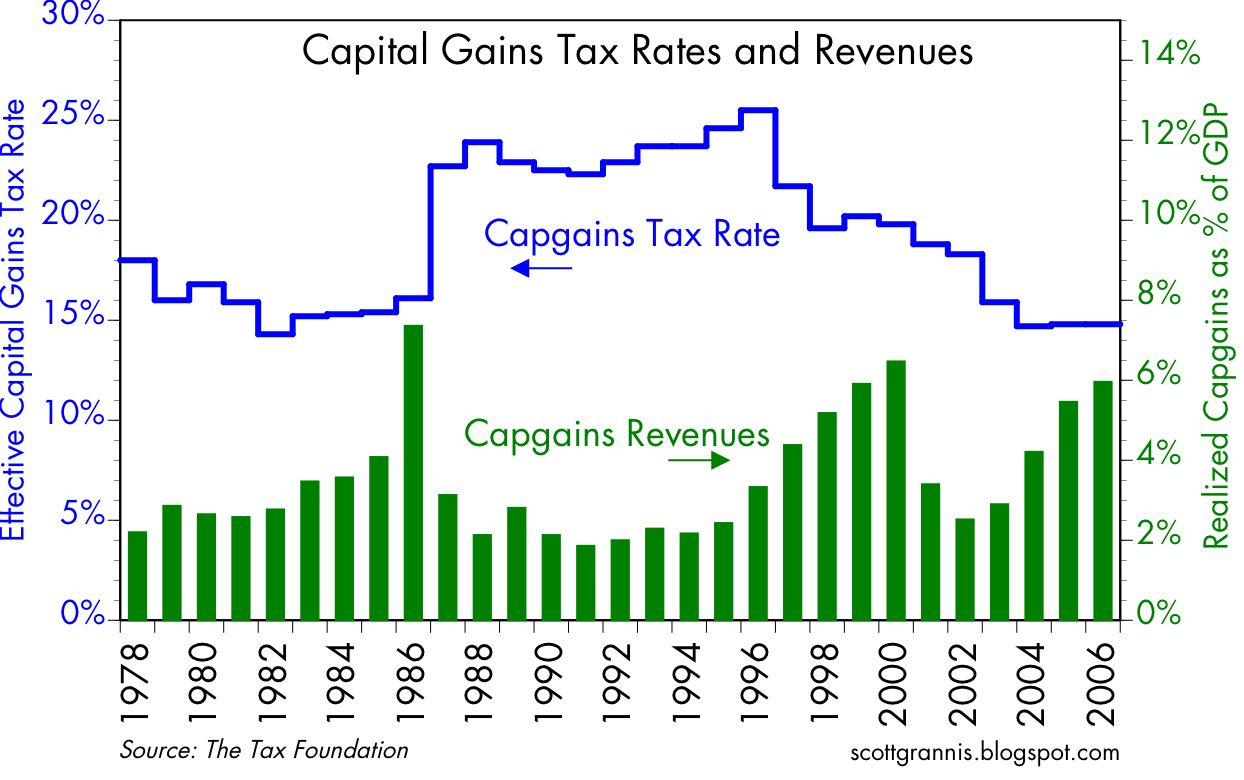
Lower Capital Gains Taxes Would Probably Cause Federal Revenues to Rise
The chart below makes it clear that people respond to incentives, especially when it comes to taxes.
- Prior to the increase in capital gains taxes in late 1986, capital gains realizations surged.
- They then fell dramatically, coming in at about half what the CBO had projected prior to the hike in the capital gains tax rate.
Note also that declining capital gains tax rates in the late 90s saw a big increase in capgain revenues—exactly the opposite of what an accountant would have projected.
The capital gains tax is the only tax you can legally avoid, by the way. All it takes is not selling something you hold at a gain.
- If we reduced capital gains taxes tomorrow I would bet a lot of money that federal revenues would rise. I for one would sell a lot of things that I have avoided selling. I would also diversify my portfolio in the process, and I would be much more willing (and able) to invest in new things.
- As it is, a lot of my money is tied up in gains that pain me to realize. It’s the same story for corporations who refuse to repatriate their profits. It’s therefore hard to overestimate the potential impact of true tax reform.
Weakness In Recent Revenues Probably Driven By Anticipation of Lower Tax Rates
The chart below shows that federal spending and revenues today are very much in line with historical experience. The weakness in revenues of late could very well be driven by the anticipation of lower tax rates.
- Taxpayers have lots of ways to postpone or defer income, just as they can postpone or defer capital gains—if they think there is a chance that tax rates will fall in the future.
- Corporations can postpone or defer new investment as well.
Given the above, it’s not wise to promise tax cuts in the future and then delay their implementation. That was the mistake that Reagan made with his first round of tax cuts; revenues promptly declined because people were waiting for the second round of cuts.

Nobody’s Betting Economy Going Above 2% Annual GDP Growth Rut Anytime Soon
The chart below compares the real yield on 5-yr TIPS to the real Fed funds rate. It’s best to think of the red line as being the market’s forecast for the average level of the blue line over the next 5 years. Right now the market is not expecting the Fed to do much more in terms of raising the real rate of short-term interest rates in coming years. That expectation, in turn, is very likely driven by the belief that the economy is going to be stuck in its 2% growth rut for as far as the eye can see.

Current Level of Real Yields Consistent With Economic Growth of about 2%
The chart below confirms that from another angle. Here we see that real yields tend to match the economy’s growth rate trend. The current level of real yields is consistent with economic growth of about 2%. If the market were more enthusiastic about the economy, TIP yields would be much higher.

The Gold Market Agrees
The gold market agrees. The prices of gold and TIPS have been strongly correlated over the years. My interpretation of this is that people are more inclined to buy gold when the economy is weak, and less inclined when it is strong. If the market really believed the economy were about to break out of its 2% growth rut, real yields would be a lot higher and gold prices a lot lower.
Why hold gold if the economy is improving? Better opportunities can be found when the economy is healthy and chugging along. Gold and TIPS have been meandering around the same levels of several years, all the while the economy has been stuck in a 2% growth rut.

munKNEE should be in everybody’s inbox and MONEY in everybody’s wallet!
Related Articles By Scott Grannis:
1. These 6 Charts Say: “What’s Going On In the U.S. Economy & Market Is Neither Unprecedented Nor Extraordinary”
Take note: what’s going on today in the economy and in the markets is not unprecedented or extraordinary. Below are 6 charts to support said contention:
2. What the Economic & Financial Tea Leaves Are Saying
My reading of the economic and financial tea leaves is that the economy continues to grow at a sub-par pace (about 2%), just as it has for the past 8 years. I don’t see evidence of a coming boom, or of an imminent bust… just more of the same. Dull. Here are a baker’s dozen charts, with the latest updates, to flesh out the story:
munKNEE.com – ” The internet’s most unique site for financial articles! Here’s why“