For the past several months everyone interested in gold & silver has been deluged with never-ending fundamental, and often compelling, information about the unprecedented demand for physical gold and silver yet, if anyone tried to buy into paper futures, it was a financial disaster thanks to the lying manipulators of the COMEX and LMBA exchanges. [However, had they been reading the markets themselves, taking note of what they were saying and taking action accordingly, they would have known when to sit on the sidelines and precisely when to pull the trigger. Below is a perfect example of how the charts timed the movement in the price of gold and silver over the past week. Yes, you CAN time the market as this article clearly demonstrates! When the market “talks,” we listen.]
So writes Michael Noonan (edgetraderplus.com) in edited excerpts from his original article* entitled Gold And Silver – Fundamentals Never Say “When.” Charts Do, And It Pays To “Listen.”
[The following article is presented by Lorimer Wilson, editor of www.munKNEE.com and the FREE Market Intelligence Report newsletter (sample here) and may have been edited ([ ]), abridged (…) and/or reformatted (some sub-titles and bold/italics emphases) for the sake of clarity and brevity to ensure a fast and easy read. This paragraph must be included in any article re-posting to avoid copyright infringement.]
Noonan goes on to say in further edited (and in some places paraphrased) excerpts:
Our constant advice was to buy, accumulate, and personally hold physical gold and silver at any price, all throughout the decline from 2011 highs. The fundamentals dictated that strategy for so many reasons, well beyond the demand situation, but just not in the futures market.
Fundamentals give the reasons for taking a particular action, but they do not provide the critical element of timing. That has changed, at least temporarily, and reading developing market activity, our constant theme, has finally entered the limelight. We use price, volume, and time as the components for reading and timing the markets.
Just as a reminder: technical aspects like moving averages, RSI, MACD, Bollinger Bands, etc., are not a consideration in reading market activity. They are artificial measures using past tense data imposed upon present tense price as a means to “predict” the future tense. We do not have any use for them. The market, itself, provides the best factual information available in order to read its intent.
The most important piece of market information always starts with the trend. Gold is now beginning to show signs of a potential bottom. It is too soon to know for certain, at least on the monthly, and weekly charts. Absent a surprise “V-Bottom,” when price rallies like a sling-shot from the lows, it takes time for a bottom to develop, so one is not being declared, as such. Instead, the weekly chart is used for context, while the daily and intra day charts are more for timing.
Gold – Weekly Chart
The 1500 area is important resistance as noted [in the chart below]. The circled small Trading Range, TR, led to a wide-range decline bar, and the high of that bar, along with the highs of the bars in the TR, forms a near-term potential resistance which is close to being tested. How price reacts to that area will provide important market information. For example, if ranges narrow on
a decline in volume, that information alerts us to likely resistance. If the ranges are wide
and volume strong, the resistance should give way.
Gold – Daily Chart
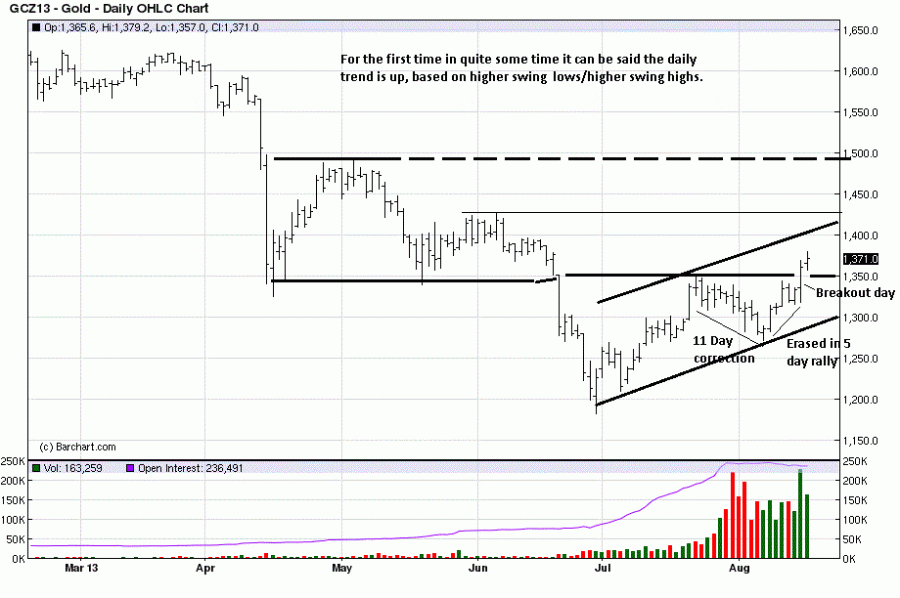
The daily chart below shows for the first time since price entered the 18 month TR, after the 2011 highs, that the daily trend is up. It may be short-lived, it may continue higher, we do not know how the next several days/weeks will develop, but we can say for certain, at least for now, there are reasons to trade from the long side.
After the mid-July absorption there was a strong breakout that stalled at obvious resistance. The market gave some important information in how price reacted. It was a labored decline in a market where prior declines were faster. The 11th day bottom was small with a close on the high and above the previous day close. That was the market telling us buyers had stopped sellers during what has been a very negative price environment.
Note how price rallied with ease over the next 3 TDs, then a two-day “correction,” and it led to last Thursday’s breakout rally, slicing right through the resistance area.
Gold – 90 Minute Chart Timed the Market
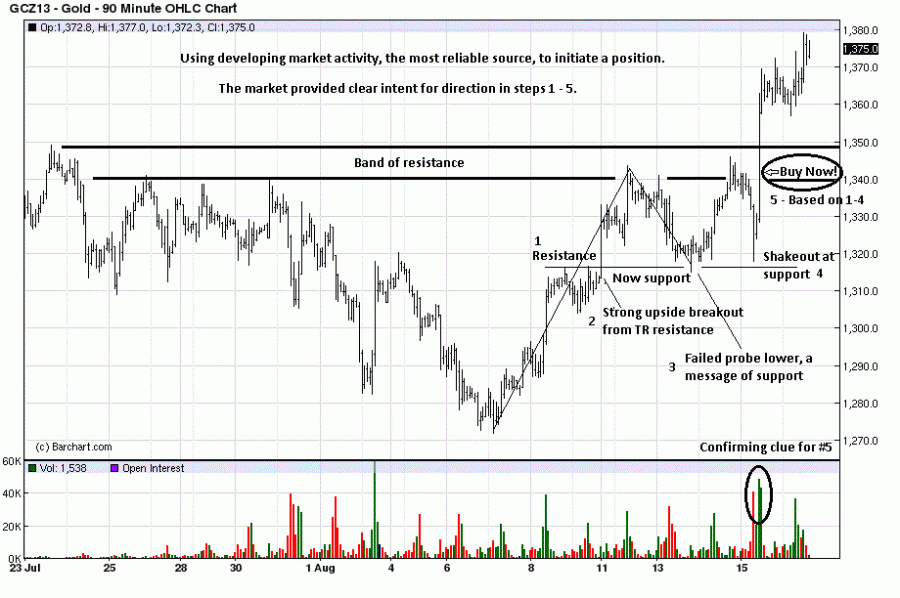
We use a 90 minute chart below to show how the market left numerous clues for taking action.
The steps are outlined, 1 – 5 below:
1 was a small TR that came from a very strong rally bar on equally strong volume. The fact that price consolidated, as opposed to correcting much lower, spoke to underlying strength coming off the lows.
At 2, there is another strong, wide-range rally bar. Volume does not show because it was during overnight hours, but the rally continued right up to resistance.
Price backed away and retraced to the highs at 1, and formed a failed probe, at 3….Price rallied back to resistance. It is not good practice to buy just below resistance, where price stopped there again, on the 14th.
What happened at 4 developed very quickly, and one had to be prepared to recognize events as they were occurring and react to them just as quickly.
From lock-and-load at 1 – 4, it was time to “fire” at 5. The spike down to the low at 4 was followed by an immediate rally back up on increased volume. That alerted us to a potential shakeout, where price drops to “shakeout” weak longs and stops, just before resuming higher. That this development was happening so near a resistance area was a message that gold was ready to move higher, according to information provided by the market itself. It was time to buy and buy now, if the read was accurate. The volume that day was important confirmation that demand had just overwhelmed supply.
The knowledge of market manipulation and huge demand for physical gold provided background that this market was due for a rally, but almost all thought the rally should have happened weeks or months ago. Finally, the charts, in reading the market activity, gave the “when” to act, with a low-risk entry. The timing for that window of opportunity was about 10 minutes. This is why we love charts and tout them as the best and most reliable source for market information and the most important element, timing.
Silver – Weekly Chart
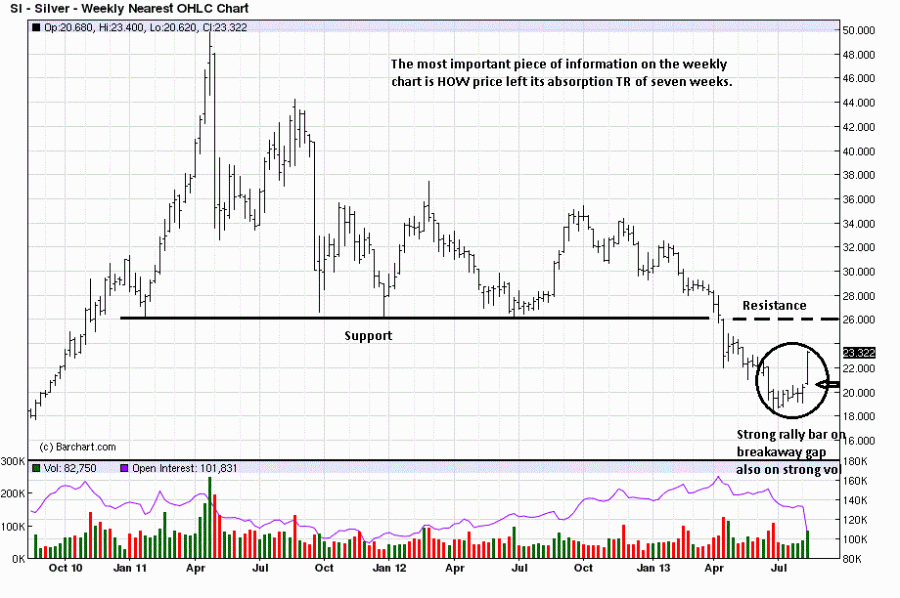
That last bar on the weekly chart below speaks volumes, a gap higher from apparent weakness. The odds of silver retesting 26 have increased dramatically.
We often mention putting developing market activity into a context as it is the vital step in preparation for when a market moves. The support-turned-into-resistance line is drawn as the market activity dictates, which most often is…simply a straight line, used for convenience and not necessarily accuracy.
The lower support/resistance line meant very little as price sailed right through 21. It shows the importance of how price reacts to an anticipated resistance. Obviously, when it goes right through, the market is telling us to expect higher levels. Silver is already testing the higher resistance line, just above 23.
The “D/S” designates Demand overcoming Supply, evidenced by the wide range up bar and on sharply higher volume. It could not be any clearer that demand, [buyers], took charge. 23+ may act as resistance but…volume and rally getting there suggests it could be short-lived.
Silver – Daily Chart
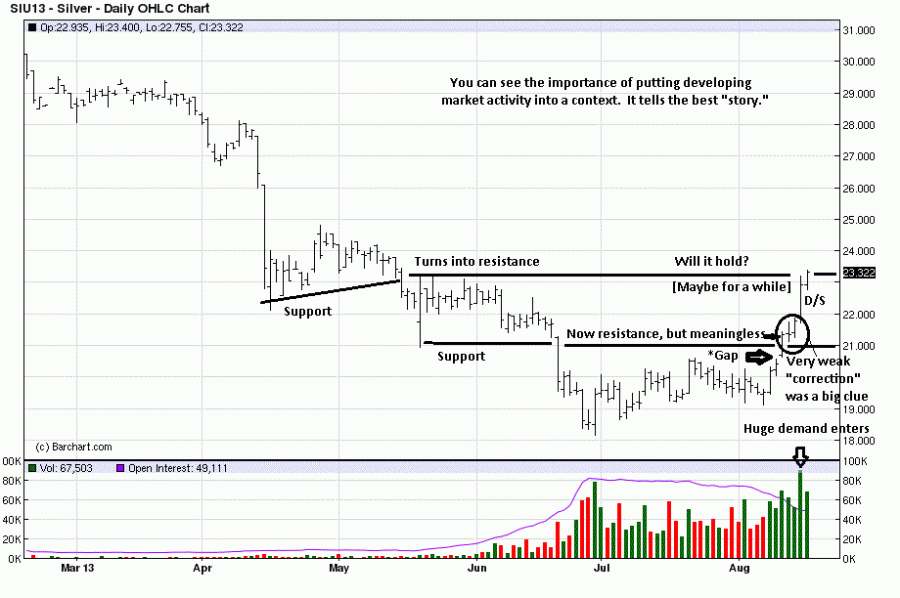
In the daily chart below you can see the day of the gap that was shown on the weekly chart. That was one of the market’s stronger messages, emphasized even more by the next two days, a consolidation in the form of a rally and not just sideways, as normally occurs.
We recommended the long side in silver earlier based on a short-term read of developing market activity but the buy signal from last Thursday was a much better one.
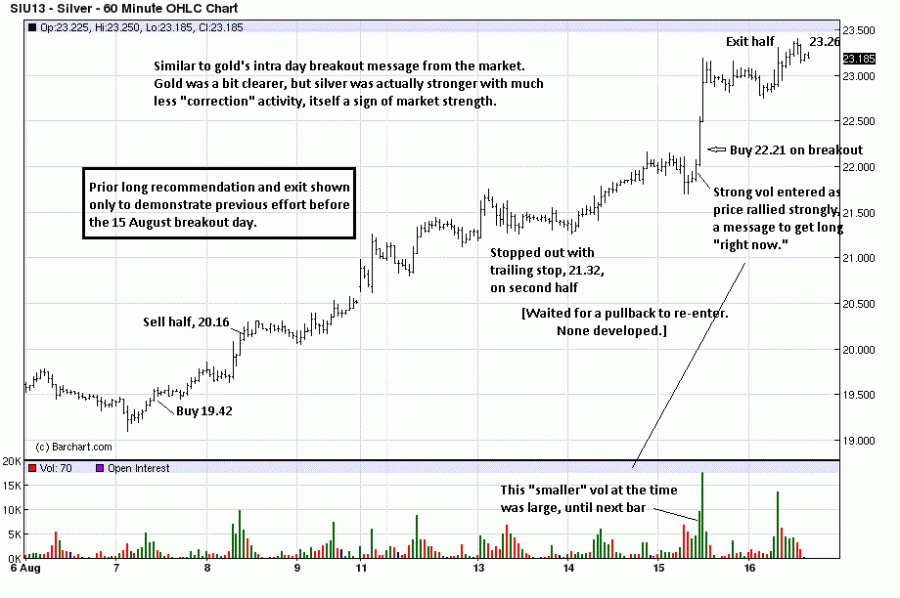
Silver – 60 Minute Chart
Timing for buying silver last Thursday, just as with gold, was very short, and one had to respond on instinct and not sit back to assess the developing information. That “instinct” actually comes from the necessary preparation work and not simply “shooting from the hip.” As the steps were shown in gold, they existed for silver, but silver had been stronger from the “signs” indicated.
It is not always this clear, but when the market “talks,” we listen.
[Editor’s Note: The author’s views and conclusions in the above article are unaltered and no personal comments have been included to maintain the integrity of the original post. Furthermore, the views, conclusions and any recommendations offered in this article are not to be construed as an endorsement of such by the editor.]
Related Noonan Articles:
1. Noonan: Window of Opportunity to Buy Physical Gold & Silver Narrowing – Don’t Wait, Buy Now!
August 12, 2013
The window of opportunity to buy physical gold and silver continues to narrow. Like the housing market top was known to be coming, when it came, those who waited too long regretted it. When the bottom for the physical PMs is known as a certainty, those who waited for a “better price” may also regret that decision. It is all about choice. Read More »
2. Noonan: The Most Factual Information On Gold & Silver Is Right HERE
August 9, 2013
In an election, it does not matter if voter turnout is high or low, the outcome is determined by the actual votes cast. The same holds true for the markets. Only those who make an actual buy or sell decision determine the outcome of the market trend. The market “voters” turn up in charts, recorded in the price range, close, and volume. Collectively, a “story” unfolds, and it usually is an accurate one as it does not include any opinions. Opinions do not matter. Articles written about fundamentals, pundit declarations, etc., all fall under the category of opinions. The market is the best source for information, and that is a fact. Read More »
3. Noonan: “Where’s the Beef?” We See None in the Charts for Gold & Silver
August 1, 2013
…Fiats have an unbroken track record of failing throughout all of history. Gold also has an unbroken track record of being a store of value for over 5,000 years. Yes, there have been hiccups along the way, and we are in one now. It is what it is, but what it is is also an incredible buying opportunity at “fire sale” prices….[That being said,] a look at the charts of the paper-tracked PM market [beg the question] … “Where’s the beef?” Where is the substance of anything? We see none in the charts. Take a look. Words: 610; Charts :4 Read More »
4. Noonan: NO Evidence of Change in Downward Trend In Gold & Silver…Yet
July 20, 2013
You will read more and more articles touting how gold and silver have bottomed. They have not, at least according to price behavior as determined by actual buyers and sellers in the market. Read More »
5. Noonan: Silver Charts Suggest This Could be the Bottom!
July 13, 2013
Charts speak the loudest…and they never lie…[because they are] the true record of all buy and sell decisions executed, coming from the most informed to the least informed. Most of the problems lie with those who form an opinion, and how they choose to impose it onto what any given chart “says.” My understanding of what the quarterly monthly, weekly and daily charts are conveying about the price action of silver is, simply,] “Silver stackers, these lower prices are a gift you should keep on taking. Stay tuned.” Read More »
6. Noonan: Charts Suggest NO Ending Price Action In Either Gold or Silver – Take a Look!
June 21, 2013
Not one Precious Metals guru has gotten anything right in the last 18 months. All have been calling for considerably higher prices. Over the past several months none called for sub-$1,300 gold and sub-$20 silver. Crystal balls do not work and never have. When it comes to markets, anything can happen [but the charts convey that] there is no apparent ending action suggesting a selling climax or even a cause for a reaction rally. Take a look. Read More »
7. Charts Provide Certainty – Not Opinion: Here’s What They Say About Gold & Silver
Charts provide certainty, for they are absolute and the final word at the end of day, week, month, etc. There can be no dispute over a bar’s high, low and close, plus the volume, for whatever the time period under consideration. There is a high degree of logic within them and, while there can be differences of opinion over their interpretation, establishing a fixed set of parameters can mitigate most any potential dispute. So just what are the charts saying about the current trend in gold and silver? Let’s take a look. Read More »
8. Gold & Silver Rules of Engagement: IF This Happens, THEN Do That – Here’s Why, Here’s How
Never go against the market. It does not matter what your beliefs are…It does not matter what the fundamentals are either. [What matters] is the TREND! Once you know the trend is up you need a game plan on how to participate from the buy side and when the trend is down, a plan ion how to participate from the short side. If there is no trend, then the odds are not favorable for either game plan.[So exactly what are the charts saying about the trend in gold and silver these days? Read on!] Read More »
9. Gold & Silver: Don’t Wait for the Bottom – “Average Down”. Here’s Why
You cannot control what others do, especially those in power. You can control what you do. Just keep buying, regardless of price, because if/when the price of gold and silver were to go lower, you may not be able to buy. If/when the price of gold and silver were to go higher, it may be at such an accelerated rate that any price in the past few years seem cheap. Words: 550 Read More »
10. Drop in Gold & Silver An Attempt to Crush PM Advocates
Everyone personally holding physical gold and silver, as we have been recommending, has no margin call to meet and no reason to sell. This is a temporary situation, and it will pass. Now is not the time to panic, as that is the intent of the central planners/bankers in forcing gold and silver through strong support levels. Stay the course. To the extent you can, continue buying the physical metal. Read More »
11. Gold & Silver: Go “Get” While the Getting is Good! Here’s Why
There will come a time, and based on current charts no one knows when, that prices for gold and silver will become prohibitive and/or governments will do what they can to inhibit (steal) ownership, maybe even making it criminal to own or use in transactions. [That being the case we advocate that you go “get”] physical gold and silver [while the getting is good], consistently and at any price. The point here is not to “make money,” but to preserve and/or create wealth. [Let me explain.] Read More »
12. The Best Article On “What Happened to the Price of Gold & Why?”
13. Spend Your Bernanke Bux Now on PHYSICAL Gold & Silver! Here’s Why!
If Venezuela were any guide, we would have to say “Buy gold and silver, right here, right now!”…For those of you who hold Bernanke Bux, aka fiat paper, pay close attention. Those Venezuelan citizens who held paper Bolivars took a 46% hit on their purchasing power. Those citizens there who held gold and silver saw an equivalent 46% jump in their holdings. If you think it cannot happen here, you are wrong. It already has. Words: 295 Read More »
14. Gold & Silver vs. Fiat: Do You Live In An Imaginary World Or In Reality?
15. Gold & Silver Are the Achilles Heel of the Largest Ponzi Scheme – Ever! Here’s Why
 munKNEE.com Your Key to Making Money



I expect to see far more “breakouts” in the near future and suspect we will also see some of them be “historic” in both their volume and their price shifts upward, especially with Silver!
Investors can justify paying $5 more per ounce (5%) far easier than paying $70 (5%) more per ounce for Gold, as both regain their “value” and their prices are rising quickly…