Forget all the news, all the fundamentals, all the mostly errant price projections  regarding gold and silver. This is one of those times where it is best to focus on pictures of the market, over various time frames, to get a better handle on what to expect moving forward. The market is “speaking” for those willing to pay attention and a look at the charts tells us, in no uncertain terms, that the end is not yet in sight.
The above introductory comments are edited excerpts from an article* by Michael Noonan (edgetraderplus.com) entitled Gold And Silver – Current Price Is The Story.
Noonan goes on to say in further edited excerpts;
We keep saying that the best and most reliable indicators come from the market. Stop listening about what others have been saying about the market and pay closer attention to what the market is saying about others.
Several months ago, we expressed the thought that 2014 would likely be more like 2013 and to not expect a dramatic increase in gold and silver prices (Noonan: Charts Suggest Lower Lows for Gold & Silver to Come in 2014 and Noonan: Gold & Silver Will Not Rally-to-the-Sky in 2014 – Here’s Why)Even that was optimistic as silver just reached recent 4 year lows…
A look at the charts tells us in no uncertain terms that the end is not yet in sight. Here is our read of what the market is saying, and has been saying for some time.
Silver
We start with silver because it just broke to low levels not seen for the past 4 years. The importance of acknowledging the trend deserves front and center attention because this simple circumstance is so often overlooked for its power to prevail over price direction.
Bearish spacing is mentioned because of what it connotes: a bearish undertone in the market. With successive lower swing highs, the message of both the trend and bearish spacing have gone unchallenged, and that means there is no way the down trend can end. The KISS principle at work.
Even in a down market, past support still has validity to check, at least temporarily, any downward momentum. It does not mean a turn in trend is imminent, so one should not read sentiment into market reality, rather, just be aware and pay closer attention to how price develops/reacts around this possible support area.
Silver – Weekly Chart
The weekly chart below is context. There are no definitive signs of trend change. None. We can see that silver has reached an oversold market condition. That being said, it can never be forgotten that oversold can easily become more oversold, so this current condition is no reason to take a position from the long side in anticipation of an upside reaction.
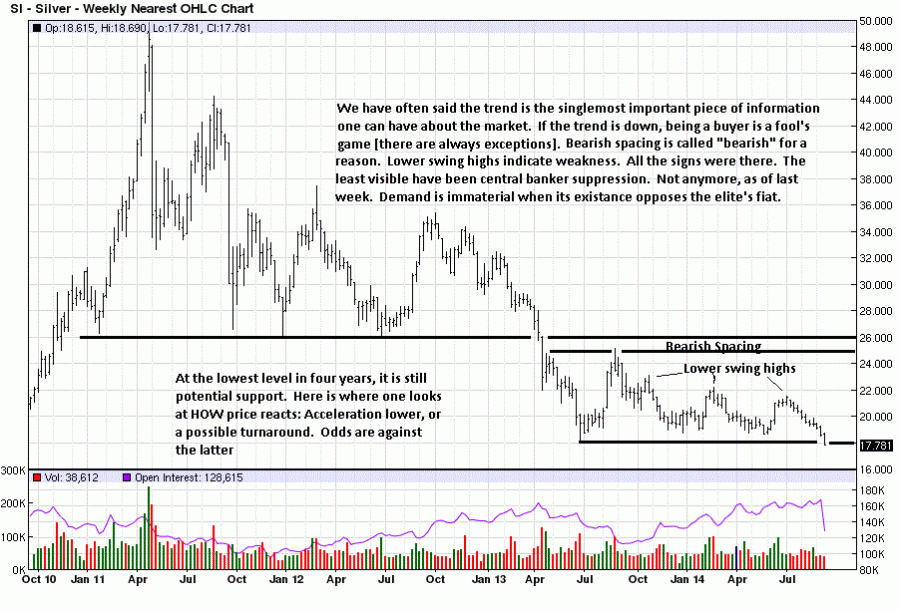
Ask yourself a simple question. Over the past 4 years, how many longs are showing a profit? Counting on just one hand may provide an adequate answer. Is that the kind of position in which you want to find yourself? This is why the trend is your friend.
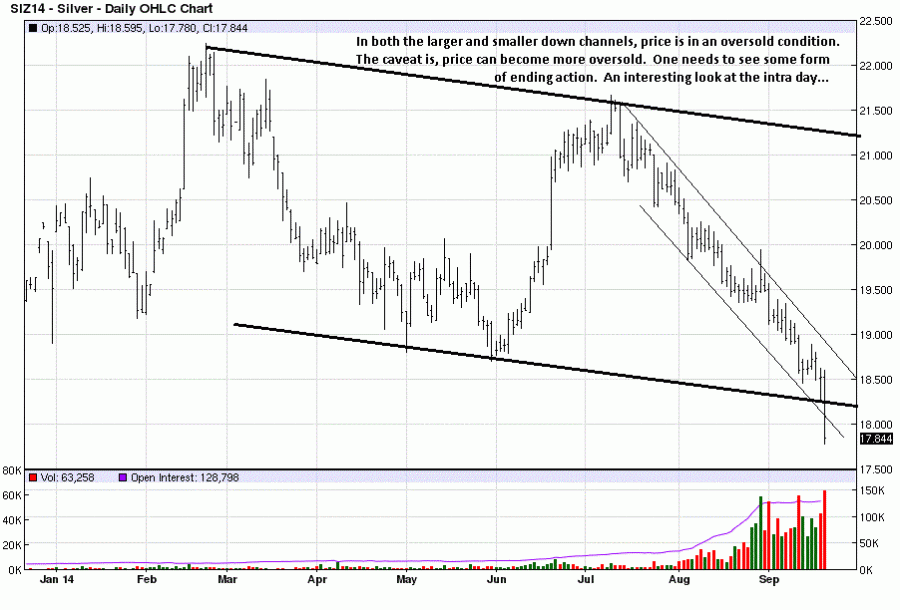
Silver – Daily Chart
The daily chart below is for more clarity, if any is to be found.
Silver – A 60-minute Chart
Trust us, a 60 minute chart is not going to overrule to strength of a weekly chart. What we want to see here is how the market looks in the aftermath of last week’s decline. The picture tells an interesting story not seen on the weekly or even the daily chart. What you have to understand is the role volume plays in any market. It is akin to the energy, or the lack of energy behind any market move.
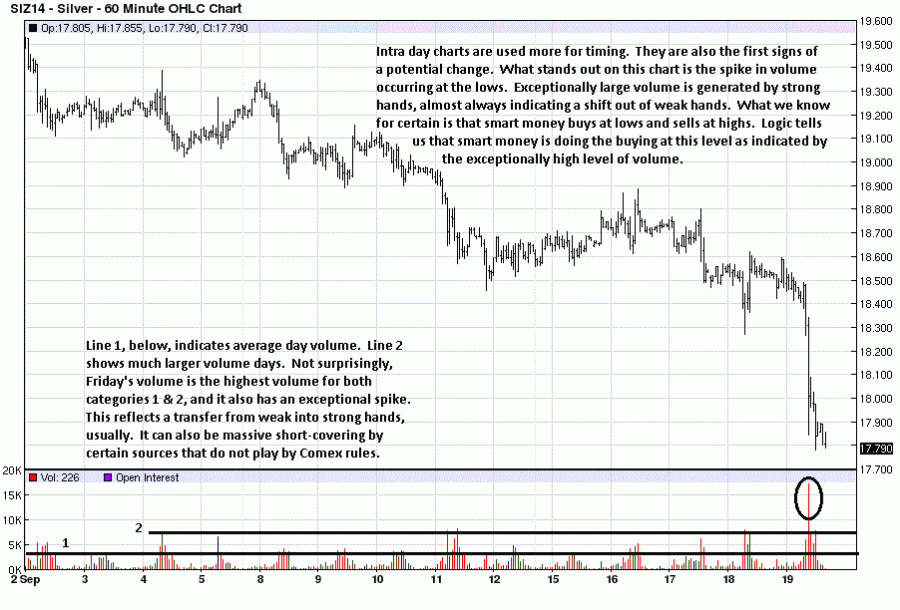
When you see sharp volume increases, pay close attention for it is usually smart money making a move, preferably without being detected. Knowing how to read volume activity, an art more than not, the intent of the market movers becomes more apparent. We are all like minnows that can buy and sell without any impact on the market. Smart money has substantial position size that must be moved over a period of days, sometimes weeks so as to not impact the market and show their hand.
The first line, marked “1″ at the bottom of the chart below shows the average volume turnover on any given day. The second line, “2,” shows notable volume pick-up and should be viewed more closely because the large market movers are doing something without trying to tip their hand.
Then, there are the exceptional spike volume standout days, such as what occurred last Friday as silver descended to 4 year lows. Anytime there is such an extreme, count on it being a change from weak hands into strong hands. Here, weak-handed sellers and stops are being triggered, and it is strong hands that are buying, strong hands that generate the exceptionally high volume. The public does not have the ability to independently create such strong volume, rather, the public reacts to it, almost always to its detriment.
What the intra day market activity from last Friday does is create a need to focus very closely on HOW the market develops over the next several days. Notice has been served that something important just occurred. When silver activity is viewed along with what transpired in gold, at the same time, the potential for change becomes a higher probability, but one that must still be confirmed. The market is “speaking” for those willing to pay attention.
Gold – Weekly
The standout difference between weekly gold and silver is that gold has not made a new recent low. In fact, gold did not even reach the Trading Range (TR) support.
Is the market “speaking” here? Yes. In fact, it does all the time, the trend being its most important message for it tells everyone that the market momentum will persist in one direction for some undetermined length of time.
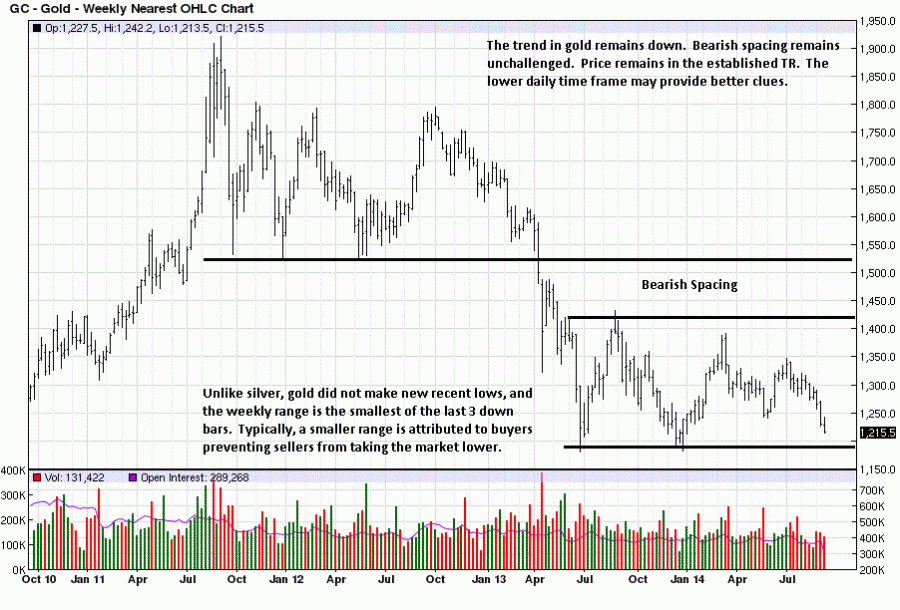
The market message we see is more at hand, and it is shown by the smaller TR from last week, compared to the two preceding weeks as the market has declined. The smaller range tells us that the downward momentum was stopped, to a degree, at a point in time where sellers have clearly been in control.
The fact that buyers prevented sellers from moving price lower than occurred does not mean the trend is changing, but it is a piece of information, just like in a jigsaw puzzle where one piece may not mean anything special, but when combined with a few other pieces interconnecting, a part of the puzzle become clearer.
Gold – Daily Chart
A look at the daily chart below may provide additional insight.
Within the same down channel as silver, gold did not even reach its lower support channel line, and that is a tribute to buyers for preventing sellers from exerting more influence with momentum on their side. We discussed how last week’s smaller range might be an important message, and the daily activity shows why.
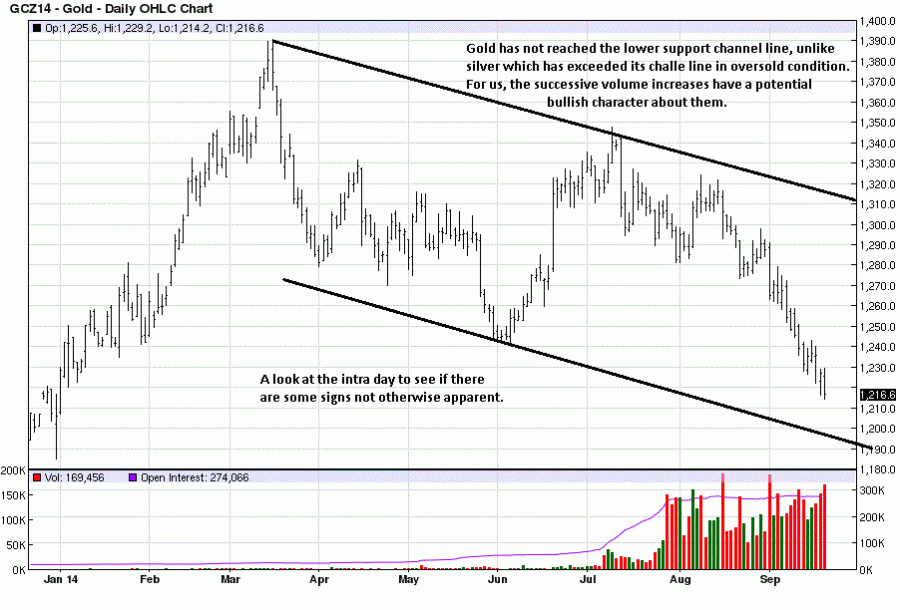
Focus on the last 3 bars [which] all…[have] red volume because each close was lower than the day preceding. The 3rd bar from the end was the widest range and lowest volume, and it tells us the there was Ease of Downward Movement (EDM), but the close was in the upper 3rd of the range, buyers winning the battle over sellers that day.
On the 2d bar from the right, volume increased, the bar range was smaller, and the close was near the high of the day, again, buyers are showing up and controlling sellers. Friday’s bar is the most interesting. Volume was second highest of the month. Increases in volume are usually attributable to smart money intervening, (which may account for why the prior two bars had higher closes; smart money trying to disguise their buying activity).
The question to be asked is, why did smart money increase the effort, via increased volume when price was at the low? It is not because they were selling into a hole, but more likely scooping up all the offerings from sellers and stops being triggered by the lower prices. Reading volume is an art form, and one can sometimes, even often, be wrong.
Gold – Intra-day Chart
Maybe the intra day chart can add to the interpretation? Indeed it does. The comments in the chart below explain the set-up. Comparing the activity, (volume effort and extent of resulting price movement) between Wednesday and Friday confirms what was surmised on the daily chart read. Pay attention to these two days and what they mean for you will see this kind of activity repeat itself over and over in all markets and over all time frames. Frankly, most people do not know how to read charts, and that is why they offer opinions about what they think is happening instead of what the market is actually saying.
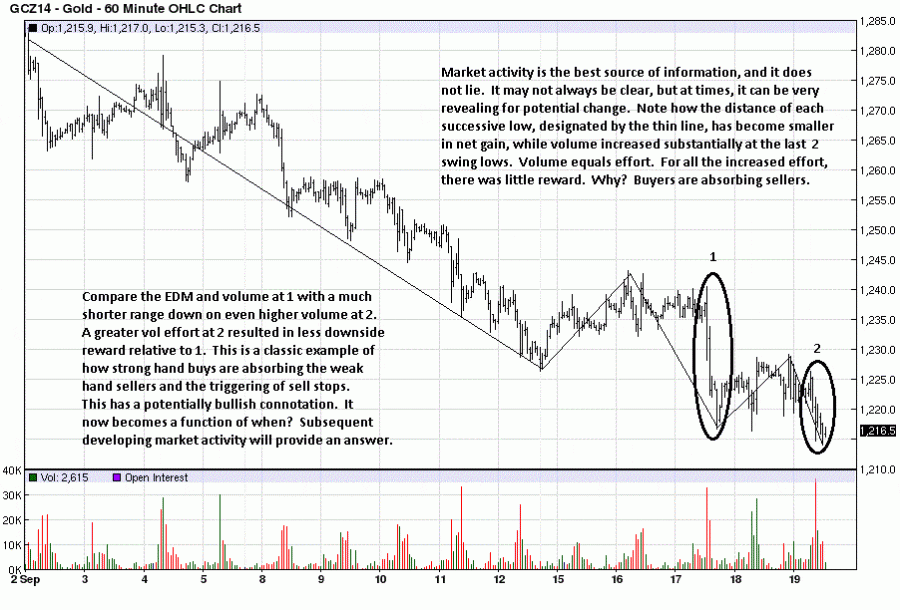
The volume effort from Friday is clearly higher than the volume effort from Wednesday, yet the EDM was much greater on Wednesday than it was on Friday. Here, you can see readily that strong hands were very active buyers on Friday, taking everything sellers had to offer, as well as all sell stops.
Will this mean a change in trend? No, but it could be an important step that leads to a change, if we see evidence that buyers are persistently putting in a greater effort than sellers. We need to be patient and wait for confirmation. Actually, there is no other choice. Those too impatient to wait for more confirmation are the ones who were more than likely selling out their longs on Wednesday and Friday from higher prices.
What does this mean for holders of the physical?
More buying opportunities.
What about those who bought at higher levels and have seen a “loss in value?”
Ask yourself this question? Are you going to sell any of your holdings at these low levels? If no, then do not be bothered about where price is, unless you are buying more. One has not “lost” anything unless one sells. You have the best form of wealth preservation insurance for what is inevitable, and 5,000 years of history is on your side…
It is wrong to focus on what one paid over the past few years as price peaked. It is necessary to look at the broader time frame. Those who have been buying silver since $4 and gold since $300 continue to do well. Keep in mind, a quarter made of 90% silver still buys a gallon of gas at today’s prices. When the price of PMs one day jumps a few hundred percentages overnight, as is likely to happen, those who paid top dollar for either metal will be overjoyed at their smart decision-making, although that is not currently how they feel.
Silver vs. Gold
The preference is for silver over gold, at this point where the ratio is around 68:1. In fact, in line with previous article, Apply Gold:Silver Ratio Ups & Downs to Greatly Increase Your PM Holdings – Here’s How, we are starting to look at switching some gold into silver. As a reminder, assume you exchange 10 oz of gold at 65:1, getting you 650 oz of silver. At some point in the future, the ratio may go under 35:1 or 30:1, and you switch back 650 oz of silver to gold at 40:1. You will then have 16 oz of gold, 60% more than previously held, all without risk, just by “playing the ratio.”
Steady the course PM holders. Add whenever possible.
Editor’s Note: The author’s views and conclusions in the above article are unaltered and no personal comments have been included to maintain the integrity of the original post. Furthermore, the views, conclusions and any recommendations offered in this article are not to be construed as an endorsement of such by the editor.
*http://edgetraderplus.com/market-commentaries/gold-and-silver-current-price-is-the-story
If you liked this article then “Follow the munKNEE” & get each new post via
- Our Newsletter (sample here)
- Twitter (#munknee)
Related Articles:
1. Noonan on Gold & Silver: “Devastating End Awaits Those Who Remain Unaware of Being Unaware”
For those who can exercise even a minimal amount of foresight, taking self-direction has never been more important. That means buying physical gold and silver at any price. Read More »
2. Apply Gold:Silver Ratio Ups & Downs to Greatly Increase Your PM Holdings – Here’s How
Should you buy & hold your gold or silver or switch back and forth depending on the gold/silver ratio? This article examines 3 scenarios and identifies certain rules that should be followed to make the most of the ups and downs of the gold/silver ratio to substantially increase your holdings over time. Read More »
3. Noonan: Not Owning Physical Gold & Silver Is A Huge Risk – Here’s Why
Once the grip of the fiat “dollar” gives way, and it is slowly losing ground, then the price for gold and silver will find their more natural value – and not until then. When might that happen? It could be weeks, it could be months, maybe even another year or two, but whenever it happens, it is more likely to be an overnight “adjustment.” Plan accordingly. Read More »
4. Noonan: Nothing Much New In Gold & Silver Charts – Take a Look
The market has not changed materially over the past many weeks/months and, as long as the market has not changed, expectations that the price of gold and silver should not change, either. Expectations are future hopes/plans that may or may not ever be realized. Present market conditions are the reality of what is, without getting into the mental gymnastics about the degree of reality reflected in the charts. Market activity trumps everything, and one works with that reality or risks substantial loss by favoring opinion/hopes/expectations. Below is what the charts are saying today. Read More »
5. Noonan: Comments On Developing Market Activity For Gold & Silver
Ignore those pundits who are saying PMs are ready to take off. If you apply a little bit of common sense, and you look at these charts, can you draw any other conclusion(s)? Always remember: the markets never lie and here is what they are saying. Read More »
6. Noonan: These Charts Say Trend STILL Bearish For Both Gold & Silver
No one knows when gold and silver will rally and anyone who says otherwise has already been proven wrong. Despite a decent rally in both gold and silver over the past 7 trading days, a look at the charts shows that both remain in bear market conditions overall with no defined indication of ongoing strength. Read More »
7. Noonan: Everything’s Upside Down, Including the Price For Gold & Silver – Here’s Why
We live in an Alice In Wonderland, circa Orwell’s 1984 world. Everything is upside down, and that includes the price for gold and silver. Read More »
8. Noonan: How Long Will These Low Prices In Gold & Silver Continue?
How long these low prices in gold and silver will continue is the ever pressing question on the minds of the gold and silver community and topic of so many articles written by the experts. While many have striven to provide an answer, and 2013 failed to match the “predictions” as to the “When?” issue, the best answer is: For as long as it takes. Here’s why. Read More »
9. Noonan: Will We See A New Gold-backed Currency?
Before gold can rally, it has to first turn the trend from down to up. We see no evidence of a change in trend. The bearish spacing is repeated, again, as a reminder that it represents a weak market within its down trend. How anyone can posit a bullish scenario from what the charts show flies in the face of known facts, as depicted in the charts. Read More »
10. Noonan: Don’t Follow the Herd Over the Cliff to Certain Financial Death – Here’s a Better Choice
Most in the United States have no idea of what is to come. They think they have no choice but to follow the herd over the cliff to certain financial death but some will be prompted to make a different choice. Let me explain. Read More »
11. Noonan: What’s It Going to Take to Cause a Sharp Price Reversal for Gold & Silver?
There is not a shred of evidence that the price of gold is about to embark upon a much higher trajectory. What the market is saying is that nothing in the news is disturbing the bottoming process. Read More »
12. Noonan: It’s PARAMOUNT to OWN some PHYSICAL Gold & Silver – Here’s WHY
Stop lamenting the current price of gold and silver and questioning the validity of owning PMs because without gold and/or silver it will be almost impossible to survive what is to come. No one knows when, but when it does, and it is a historical certainty, are you really going to care what you paid for your gold and silver? Read More »
13. Noonan: Gold Remains Low For These Compelling Reasons
The current unnatural control over the natural forces of Supply/Demand could continue much longer than most expect – the disappointing expectations for 2013 may repeat in 2014. Here is how we see the developing “story” that explains why gold and silver have not changed trend. Read More »
14. Noonan: Forget About $5,000+ Gold; It Ain’t Goin’ Happen Any Time Soon!
Tell us where in the charts below there are any indications that the “true” value for gold should be in the $5,000 – $10,000 per troy ounce range, or silver in the $100 – $300 range. If you see extraordinary bullish signs within them, let us know, because we certainly keep looking and cannot find any needle in these “haystack” charts! Read More »
15. Noonan: The “Rothschild System” & the Present and Future Price of Gold
If the East has gained control of the gold, and the West is essentially insolvent to its core, why aren’t gold and silver finding a higher level that, at a minimum, would reflect a simple adjustment for inflation for the past few decades? The answer is really quite simple: the “Rothschild formula” is is alive and well. Let me explain just what the Rothschild formula is and how it is influencing the price of gold. Read More »
16. Noonan: Gold & Silver Will Not Rally-to-the-Sky in 2014 – Here’s Why
No matter what you hear or read about gold and the prospects for substantially higher price levels, the trend is down, exactly opposite of what you know. When you compare what you know, an opinion, with what the market is telling you, the market is a more accurate measure, however counter-intuitive it may be to your opinion, [and THIS is what the markets are saying]. Read More »
17. Noonan: These Are the Facts About the Current Price Movement In Gold & Silver
We are starting to see some subtle changes in market behavior but the trend currently remains down for both gold and silver. For those who want to grow their capital, the best time to make a market commitment is with the trend and given how no one knows how the market will correct, it is best to wait and see first what the market reveals. Below are some daily and weekly charts on gold & silver charts to show you how things are developing. Read More »
18. Noonan: The Trend in Gold Remains Down – But For How Long?
If your perception is focused solely on where the price of gold is, as opposed to where you think or believe it ought to be, the elites would like to sell you a renewable subscription to their “Fiat Is Better” newsletter. Read More »
19. Noonan: Charts Suggest Lower Lows for Gold & Silver to Come in 2014
Because the natural laws of supply and demand do not apply to gold and silver, the only way we can track the influence of endless paper supply on the market is through the most reliable source, the market itself, and the best way to track the market is through charts. Let’s take a look at what they are conveying today. Read More »
20. Noonan: “Gold Ain’t Going Higher – At Least For the Short Term” – and Here’s Why
Does the fast-fading world reserve currency [the USD] look like it is collapsing? A look at the performance of the U.S. Dollar Index does not suggest that it is, weak as it is. If the fiat dollar is not in danger of imminent “collapse,” or even breaking down, then gold does not have this event as an impetus for rallying higher. [Frankly speaking,] until that changes, gold ain’t going higher, at least in the short term. Read More »
21. Noonan: Charts Say NO End In Sight for Decline In Gold & Silver Prices
No matter what the latest “news” development is for PMs that paints a rosy picture, those in the fundamentalist camp are looking through rose-colored glasses to expect change in the near future. The charts for gold & silver continue to tell a more accurate story that belie all known fundamentals, and the charts shown here depict a market in decline with no apparent end in sight. Read More »
22. Noonan on Gold & Silver: “When Fundamentals Fail, Charts Prevail” & This Is What They’re Conveying
Fundamentals are relative, charts are absolute. They accurately reflect all that is going on, regardless of reasoning/motivation and…right now, the charts are letting us know that higher PM prices are unlikely to occur anytime soon. Barring some kind of “overnight surprise” that will shock the markets, odds favor lower prices over higher prices unless and until demand shows up in chart activity. Read More »
23. Noonan: Charts are Infallible! Here’s Why & What They’re Saying About Gold & Silver
Some of the finest and most highly regarded minds in the world of PMs have been saying gold and silver are going higher…[but] the charts have “said” otherwise, and that has been the correct read…The fundamentals may be as bullish as can be [but] the charts are sending a different message. Read More »
24. Noonan: Gold & Silver Could Move Sideways for Another 1-2 Years – Here’s Why
Using past history of how price responds, it is likely that gold, and silver, could move sideways for another year or two. While this flies in the face of so many current, supposedly “expert”, opinions [mine is not based on opinion but, rather, is strictly based on the facts as conveyed by the charts. Take a look and you will see that too!] Read More »
25. Noonan: These Charts Clearly Show What’s Happening With Gold & Silver – Take a Look
Below is a perfect example of how the charts timed the movement in the price of gold and silver over the past week. Yes, you CAN time the market as this article clearly demonstrates! When the market “talks,” we listen.] Read More »
26. Noonan: Window of Opportunity to Buy Physical Gold & Silver Narrowing – Don’t Wait, Buy Now!
The window of opportunity to buy physical gold and silver continues to narrow. Like the housing market top was known to be coming, when it came, those who waited too long regretted it. When the bottom for the physical PMs is known as a certainty, those who waited for a “better price” may also regret that decision. It is all about choice. Read More »
27. Noonan: The Most Factual Information On Gold & Silver Is Right HERE
In an election, it does not matter if voter turnout is high or low, the outcome is determined by the actual votes cast. The same holds true for the markets. Only those who make an actual buy or sell decision determine the outcome of the market trend. The market “voters” turn up in charts, recorded in the price range, close, and volume. Collectively, a “story” unfolds, and it usually is an accurate one as it does not include any opinions. Opinions do not matter. Articles written about fundamentals, pundit declarations, etc., all fall under the category of opinions. The market is the best source for information, and that is a fact. Read More »
28. Noonan: “Where’s the Beef?” We See None in the Charts for Gold & Silver
Fiats have an unbroken track record of failing throughout all of history. Gold also has an unbroken track record of being a store of value for over 5,000 years. Yes, there have been hiccups along the way, and we are in one now. It is what it is, but what it is is also an incredible buying opportunity at “fire sale” prices….[That being said,] a look at the charts of the paper-tracked PM market [beg the question] … “Where’s the beef?” Where is the substance of anything? We see none in the charts. Take a look. Words: 610; Charts :4 Read More »
29. Noonan: NO Evidence of Change in Downward Trend In Gold & Silver…Yet
You will read more and more articles touting how gold and silver have bottomed. They have not, at least according to price behavior as determined by actual buyers and sellers in the market. Read More »
30. Noonan: Charts Suggest Potential Support for Gold Down at $1,040 to $1,100
If you want to make rabbit stew, first, you have to catch the rabbit so hopefully, first, we’ll see some concrete signs that a bottom is in before the regurgitation of “Gold is going to $10,000!” starts showing up in a host of new articles pandering for attention. The best way is to decide for yourself…so let us go to the most reliable source, the market, and see what the prices of gold and silver have to say about what everyone else has been saying about them. People have been known to exaggerate, even lie in their “opinions,” but the market never does either. Read More »
31. Noonan: Charts Suggest NO Ending Price Action In Either Gold or Silver – Take a Look!
Not one Precious Metals guru has gotten anything right in the last 18 months. All have been calling for considerably higher prices. Over the past several months none called for sub-$1,300 gold and sub-$20 silver. Crystal balls do not work and never have. When it comes to markets, anything can happen [but the charts convey that] there is no apparent ending action suggesting a selling climax or even a cause for a reaction rally. Take a look. Read More »
 munKNEE.com Your Key to Making Money


