The deteriorating junk bond market, along with rising credit spreads, is indicating that we will have a stock market correction in about 3-6 months. Here are the details.
Junk Market Yield is Deteriorating
There is a particular debt market that is very interesting to watch, and that is the junk bond market… We call these bonds “junk bonds”, because the debt is issued by corporations that do not have high credit ratings, and they need to pay higher interest rates.
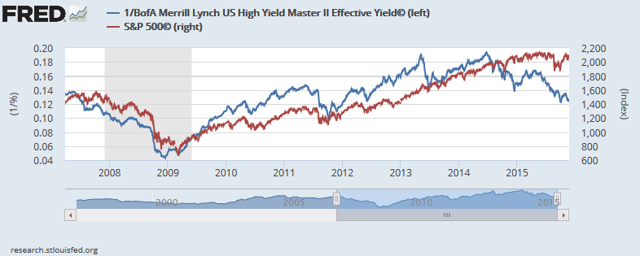
The reason why we need to monitor this market is as follows. The high yield debt market is a leading indicator for the direction of the stock market… Whenever investors leave the junk bond market, yields will spike upwards and the price of these bonds will decline in value. This will lead to less borrowing, and consequently, less spending. What we then see is a stock market crash, typically with a delay of a few months (see chart below from FRED).
You can clearly see that the stock market (red chart) is overdue for a correction as the high yield bond market (blue chart) is declining in value.
Buybacks are Peaking
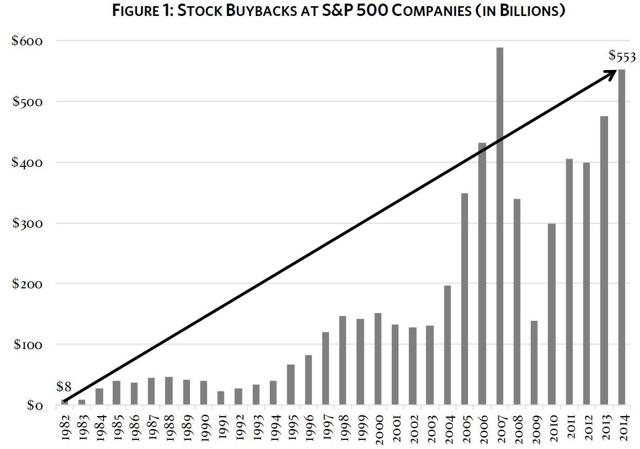
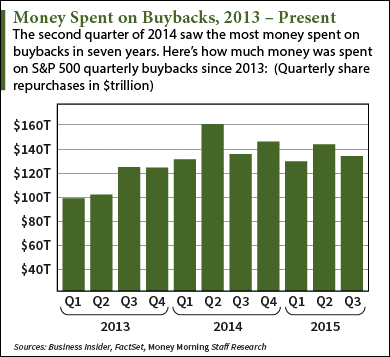
Another way of looking at this is to look at buybacks. It is common knowledge that stock buybacks have led to the rise in equities over the past few years. These buybacks have soared, and are at multi-year highs in 2015 (see chart below).
These buybacks were all financed by cheap credit, which people loved to invest in because they provided higher yields than the low interest rates on their bank account but as credit is now deteriorating, these bondholders are fleeing out of the bond market and bond yields are starting to spike. As a result, it is more difficult to borrow money to finance these stock buybacks. Hence, the stock market will start to crash. We already have evidence that the stock buyback spree which began in 2013 has ended (see chart below from Business Insider).
Credit Spread is Widening
…As corporate debt is deteriorating, investors will seek for safer alternatives, one of which is U.S. Treasuries. When people go from corporate debt into U.S. Treasuries, this will result in lower yields on the Treasuries and higher yields on corporate debt. There is a way to monitor this trend, and that is called credit spread.
A credit spread is the difference in yield between two bonds of similar maturity, but different credit quality. For example, if the 10-year Treasury note is trading at a yield of 2% and a 10-year corporate bond is trading at a yield of 4%, the corporate bond is said to offer a 200-basis point spread over the Treasury.
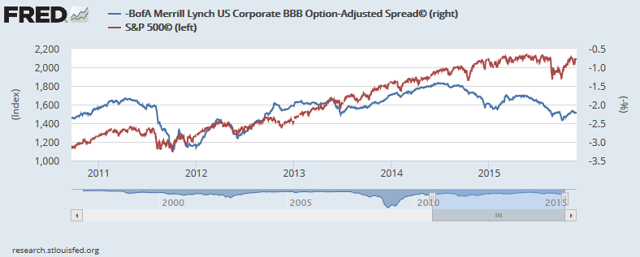
In this particular case, we will see a widening credit spread as corporate bond yields go up and U.S. Treasury yields go down. The chart below from FRED illustrates that credit spreads are rising (blue chart declining), while we still need to see the stock market react to that to the downside (red chart to start declining).
Conclusion:
The deteriorating junk bond market, along with rising credit spreads, is indicating that we will have a stock market correction in about 3-6 months.
Want more such articles? Just “follow the munKNEE” on Twitter; visit our Facebook page; or subscribe to our free newsletter – see sample here.
The above article* was written by Katchum (Correlation Economics) and is presented here by the editorial team of munKNEE.com (Your Key to Making Money!) and the FREE Market Intelligence Report newsletter (see sample here) in a slightly edited ([ ]) and abridged (…) format to provide a fast and easy read.]
*Original Source: http://katchum.blogspot.be/2015/11/junk-bond-market-forecasts-looming.html
Related Articles from the munKNEE Vault:
-
If You Own Stocks Then This Article Is a MUST Read
Don’t be one of the people who don’t understand the vital importance of the bond market and what it’s telling you right now. This knowledge could help you avoid a huge hit to your net worth over the next 12-24 months. Here’s why.
2. US Dollar Rally Will Signal A Stock Market Crash – Here’s Why
The global carry trade (meaning money borrowed in US Dollars and invested in other assets) stands at over $9 TRILLION (larger than the economy of France and Brazil combined) but, given the U.S. dollar rally combined with the Fed’s hint at raising rates in December, it is at risk of blowing up. Here’s why.
3. This Ratio Is An Ugly Warning Sign For the Stock Market
Historically, the performance of the S&P 500 Index relative to the U.S. Dollar Index has been a good indicator of bull and bear markets but it has underperformed the Dollar Index since mid-2014. It’s an ugly warning sign for the market. I see the stock market moving downward from here.
4. Copper Price/U.S. Index Values Gap Not A Good Sign – Here’s Why
The large gap between the price of copper and U.S. indices is a warning sign that investors should take into consideration before starting new positions. Here’s why.
5. What Do Wall Street’s Pros Forecast For S&P 500 In 2016?
Wall Street’s stock market gurus are still looking pretty bullish as many continue to forecast double-digit gains over the next year.
6. Lumber:Gold Ratio Says What About the Stock Market?
Comparing Lumber (sensitive to housing) and Gold (sensitive to implied stock market volatility) can be predictive of what comes next [for each].
 munKNEE.com Your Key to Making Money
