 that what was always believed during the “mania” phase of every previous bull market cycle? With the current bull market now stretching into its sixth year; it seems appropriate to review the three very distinct phases of historical bull market cycles.
The following article is presented by Lorimer Wilson, editor of www.munKNEE.com (Your Key to Making Money!), and has been edited, abridged and/or reformatted (some sub-titles and bold/italics emphases) for the sake of clarity and brevity to ensure a fast and easy read. This paragraph must be included in any article re-posting to avoid copyright infringement.
Phase 1) “What bull market? The fall is right around the corner”
…Following a massive, mean reverting, correction – markets tend to bottom and begin an initial recovery. Most individuals have been crushed by the previous market decline and only recently “panicked sold” into cash.
There are many signs during the initial phase that a new bullish uptrend has started. Money flows from defensive names in order to chase higher yield, market breadth is improving, and volatility declines substantially.
However, despite those indications, many individuals do not believe that the rally is real. They use the rally to sell into cash and angrily leave the markets or continue to stay in cash expecting another failure.
Note: The fastest price appreciation in the market happens during the first and third stages of the bull market.
Phase 2) Acceptance stage
During the second phase individuals gradually warm up to the idea that the markets have indeed bottomed the psychology changes to one of acceptance. At this point, the market is generally considered “innocent until proven guilty.“
The overall psychology remains very cautionary during this second phase. Investors react very negatively any short term market correction believing the bull market just ended. They continue to remain underweight equities and overweight defensive positions and cash.
During the second phase stocks continue to climb higher and market corrections are short-lived. It is between second and third phases that a deeper market pullback occurs. This pullback tests the resilience of the rally, shakes weak hands out of the market, and allows for new bases to be formed. This deeper pullback is used as a buying opportunity by institutions, which missed the initial stages of the rally, and their buying continues to push the markets to new highs.
Phase 3) Everything will go up forever
During the first phase, most individuals remain skeptical of a market that has just gone through a high-correlation, mean-reverting correction. It is at this point that most investors are unwilling to see the positive change in market dynamics.
In phase two, however, investors gradually turn bullish for the simple reason that prices have been steadily rising for some time. Analysts and strategists are also turning universally “bullish” in an attempt to manage their career risk and attract investor dollars.
In the final phase of the bull market, market participants become ecstatic – driven by continually rising prices and a belief that the markets have become a “no risk opportunity.”
- Fundamental arguments are generally dismissed as “this time is different.”
- The media chastises anyone who contradicts the bullish view, bad news is ignored, and everything seems easy.
- The future looks “rosy” and complacency takes over proper due diligence.
- There is a near complete rotation out of “safety” and into “risk.”
- Previously cautious investors dump conservative advice, and holdings, for last year’s hot “hand” and picks.
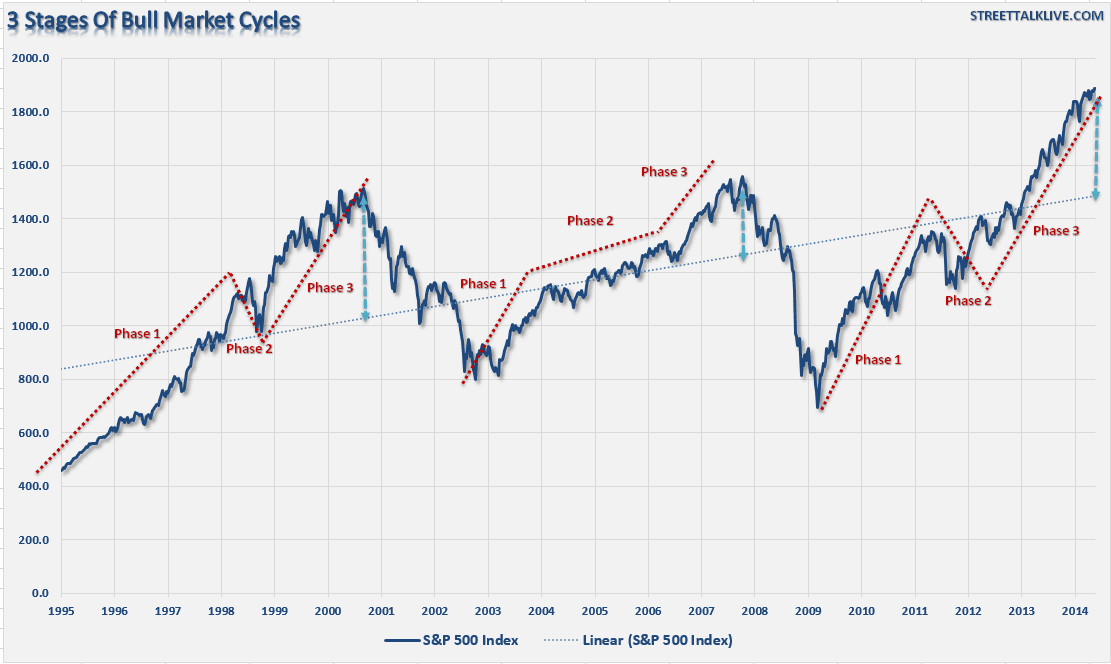
The chart below shows these three phases of the bull market over the past three market cycles.
Note: I have highlighted with blue vertical lines the deviation between current prices and the linear trend of the index. The current extreme price divergence is not indefinitely sustainable.
While the current bull market remains “bulletproof” at the moment to geopolitical events, technical deterioration, overbought conditions and extremely complacent conditions; it is worth remembering what was being said during the third phase of the previous two bull markets:
- Low inflation supports higher valuations
- Valuation based on forward estimates shows stocks are cheap.
- Low interest rates suggest that stocks can go higher.
- Nothing can stop this market from going higher.
- There is no risk of a recession on the horizon.
- Markets always climb a wall of worry.
- “This time is different than last time.”
- This market is not anything like (name your previous correction year.)
Well, you get the idea.
Are we in the third phase of a bull market? Most who read this article will immediately say “no” but isn’t that what was always believed during the “mania” phase of every previous bull market cycle?
Editor’s Note: The author’s views and conclusions in the above article are unaltered and no personal comments have been included to maintain the integrity of the original post. Furthermore, the views, conclusions and any recommendations offered in this article are not to be construed as an endorsement of such by the editor.
*http://streettalklive.com/index.php/analysis/daily-x-change.html?id=2234
Related Articles:
1. Is Now the Calm Before the Storm?
I’d argue that the record low volume shows investors aren’t looking ahead as much as looking behind and reminiscing at how good things have been over the past five years or so. They’re expecting more of the same even though it’s mathematically impossible people. Read More »
Current macro conditions indicate that we are in a sweet spot for equity returns…that global growth is continuing and there is little or no tail risk in the immediate future. It’s time to get long equities…but I have this nagging feeling that these market conditions are too good to be true. If you look, there are a number of technical and fundamental clouds on the horizon. Read More »
6. Margin Debt: It Doesn’t Matter ’til It Matters! Is Now the Time to Be Worried About the S&P 500?It doesn’t matter until it matters! IF margin debt should start decreasing swiftly, history would suggest something different is taking place in the mind of aggressive investors. Will a decline in margin debt from all-time highs matter this time? Read More »
7. The Best Stock Market Indicator – Ever
Below is a description of what I believe to be the best stock market indicator – ever. I am referring to the percentage of S&P 100 stocks above their 200 DMA which gives traders a clear early warning signal of impending serious market downturns and later safe re-entry points. Read More »
8. We’re on the Precipice of a 50% Drop in the U. S. Stock Market! Here’s Why
Warren Buffett’s favorite indicator – the ratio of the value of U.S. stocks to GDP – is seen by him as a reliable gauge of where the market stands and these days it suggests that all the main indexes are pointing to an imminent 50% crash. Read More »
9. 2 Stock Market Indicators Are Saying “Be careful, don’t get caught up in the euphoria”
In the midst of all the optimism we see towards key stock indices these days, there are two leading indicators that are flashing warning signals. They say, “Be careful, and don’t get caught up in the euphoria.” Read More »
10. Beginnings of Massive Stock Market Correction Developing: Don’t Delay, Prepare Today!
No stock can resist gravity forever. What goes up must eventually come down. This is especially true for stock prices that become grotesquely distorted. We have been – and still are – living in another dotcom bubble, and – like the last one – it is inevitable that it is going to burst. Read More »
 munKNEE.com Your Key to Making Money


Excellent write-up. I definitely love this website. Keep writing!