Warren Buffett likes to counsel individual investors to buy-and-hold (specifically, buy an equity index fund and hold it forever). This is a perfect example of “do as I say, not as I do,” as Buffett has successfully timed the market for decades and, [interestingly,] Buffett is now carrying his largest cash position ever in stark contrast to individual investors who now hold their smallest cash positions since the height of the internet bubble. Clearly, he’s timing once again and I’m sure a few of you are wondering just how he manages to do this so successfully. [Let me explain.]
By Jesse Felder (thefelderreport.com). Originally posted* under the title How To Time The Market Like Warren Buffett.
…Warren Buffett’s investment philosophy [is put forth] in the Berkshire Hathaway Chairman’s Letter of 1992 in which he wrote:
“The investment shown by the discounted-flows-of-cash calculation to be the cheapest is the one that the investor should purchase… Moreover, though the value equation has usually shown equities to be cheaper than bonds, that result is not inevitable: When bonds are calculated to be the more attractive investment, they should be bought.”
In other words, ‘when stocks are better value buy them. When bonds are the better value buy them.’ Couldn’t be simpler; could it, but how does Buffett calculate “value?” In the quote above he references “discounted-flows-of-cash,” a very complicated valuation model that relies on many assumptions that can cause all sorts of problems. I think there’s actually a much easier way to look at it.
Back in 1999, when he decided to market-time the internet bubble (well done, sir), Buffett hinted at his process telling Fortune, “I think it’s very hard to come up with a persuasive case that equities will over the next 17 years perform anything like–anything like–they’ve performed in the past 17”, so what tool does he use to make a “persuasive case?” A couple years later, once again via Fortune, he revealed it: the ratio of total stock market capitalization-to-GNP (or GDP), calling it, “probably the best single measure of where valuations stand at any given moment.”
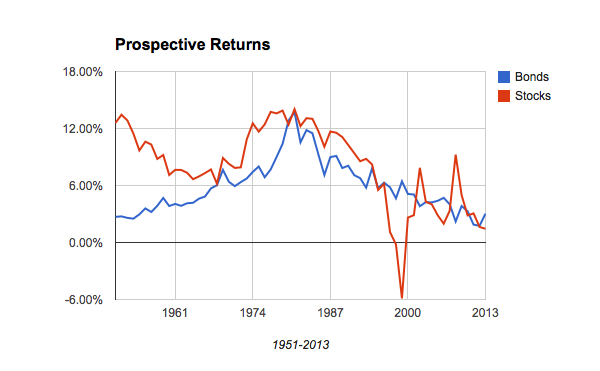
Okay, but HOW does he use it? Here’s my best guess: John Hussman has done some work with this indicator and found that it is very closely correlated to future returns in the stock market. In other words, this indicator is very good a predicting future returns for stocks over the coming decade.
When Buffett said in 1999 that the next 17 years were very unlikely to look like the prior 17, he meant that:
- the starting valuation in 1982 was so attractive (based on his favorite yardstick, market cap-to-GDP, which stood at 0.333) it virtually guaranteed wonderful returns over the coming decade and, conversely,
- the starting valuation in 1999 was so unattractive (based on the same yardstick reading of 1.536, or 4.5 times higher than the 1982 reading) it virtually guaranteed horrible returns.
- I ran the numbers on Buffett’s yardstick and its predictive ability myself, using the data from FRED and Robert Shiller covering the years from 1950 to 2013, and found it to be negatively correlated (low values correlate with better 10-year returns and vice versa) by over 80%.
- I then created a forecasting model based on the data which tells us what stock market future annualized returns should be over the coming decade based upon the current reading of the yardstick…
- [I then took the generated number] and simply compared it to the current yield on the 10-year Treasury note to see which offered the best return over the coming decade, just as Buffett prescribes, that is,
- when stocks offer a better return, they should be bought and, conversely,
- when the 10-year treasury offers a better return it should be bought. Simple.
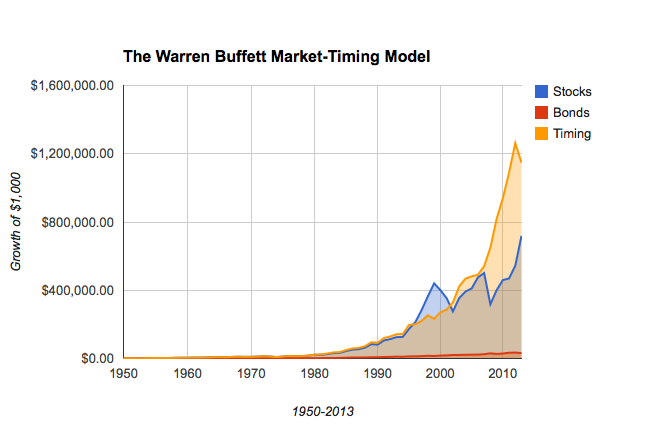
[Below you can see]…what would have happened if someone had followed this model, only looking at it once a year at year-end, starting back in 1950…
They would have:
- owned stocks from 1950 to 1981,
- switched into treasuries for only a year.
- owned stocks again from that point until 1996 when bonds offered the greater prospective return,
- stayed out of stocks for nearly the next decade (through the rise and fall of the internet bubble),
- sold their bonds in January 2003,
- bought stocks again…for [a period of] two years and then
- switched into bonds again in 2005
- bought stocks again until January 2009, after the heart of the financial crisis had already passed and stocks were once again attractively valued relative to bonds, then
- switched into treasuries again at the end of 2012 and
- still hold those treasuries today.
How did…[the hypothetical investor] do? Even after missing the massive gains of the internet bubble and those we saw in stocks over the years, [see chart below] this hypothetical Warren Buffett-wannabe-market-timer…[would have seen]:
- $1,000 grow to roughly $1.15 million today
- compared to $720k for the buy-and-hold investor and
- a mere $32k for the all-bonds guy.
All the hypothetical investor did was buy stocks when they were more attractive; otherwise bought bonds. Simple.
Conclusion
This model is merely for educational purposes – it doesn’t factor in transaction costs or taxes (which could be huge) – so it’s not in any way a recommendation for you to use with your investments…[That being said,] it’s definitely something to consider when evaluating investment opportunities on a broad basis or deciding where to put new money to work.
[The above article is presented by Lorimer Wilson, editor of www.munKNEE.com and www.FinancialArticleSummariesToday.com and the FREE Market Intelligence Report newsletter (sample here) and may have been edited ([ ]), abridged (…) and/or reformatted (some sub-titles and bold/italics emphases) for the sake of clarity and brevity to ensure a fast and easy read. The author’s views and conclusions are unaltered and no personal comments have been included to maintain the integrity of the original article. This paragraph must be included in any article re-posting to avoid copyright infringement.]
*http://thefelderreport.com/2014/08/07/how-to-time-the-market-like-warren-buffett/
Stay connected!
- Register for our Newsletter (sample here)
- Find us on Facebook
- Follow us on Twitter (#munknee)
- Subscribe via RSS
Related Articles:
1. Is “Buy & Hold” the Way to Go?
One of the great myths about investing that we’re told by the mainstream investment education is that we should “buy and hold” for the long term [but, as this article will explain,] it’s time to move on from the mainstream. There’s too much technology and too many global options now to be lulled into conventional investments that are born to lose. Read More »
2. Buy, Hold or Sell? Time the Market By Watching Change In Market Trends! Here’s How
The trend is your friend and this article reviews the 7 most popular trend indicators to help you make an extensive and in-depth assessment of whether you should be buying or selling. If ever there was a “cut and save” investment advisory this article is it. Read More »
3. Don’t Try to Time the Market; Dollar-Cost Average Instead. Here’s Why
Everyone is worrying that we are at or near a market peak and this has investors extremely hesitant to buy stocks for fear of a big decline or perhaps even a crash. Obsessing over the risk of a crash, however, could lead to analysis paralysis but there is a basic investing strategy that can save investors from losing too much hair as they make the decision to buy stocks. It’s called dollar-cost averaging. Let me explain how it works and why it’s great for investors with long-term investing horizons. Read More »
4. Go With the Flow! Time the Market By Using These 6 Momentum Indicators
Yes, you can time the market! Assessing the relative levels of greed and fear in the market at any given point in time is an effective way of doing so and this article outlines the 6 most popular momentum indicators and explains how, why and where they should be used. Read More »
5. Time, Not Market Timing, Is Key To Investment Success
Time, not timing, is key to investment success. The bull market will end at some point. Stocks will go down and we will eventually see a bear market. These things happen. When it happens is up to Mr. Market. Let me explain. Read More »
6. Bubbles: Doing NOTHING Is Often the BEST Response – Here’s Why
The benefits of being able to detect a bubble, when you are in its midst, rather than after it bursts, is that you may be able to protect yourself from its consequences. [Below are possible] mechanisms to detect bubbles, how well they work and what to do when you think a particular asset is in one. Read More »
7. Time the Market Using Market Strength & Volatility Indicators – Here’s How
There are many indicators available that provide information on stock and index movement to help you time the market and make money. Market strength and volatility are two such categories of indicators and a description of six of them are described in this “cut and save” article. Read on! Read More »
8. This Indicator Is 94% (Yes, 94%!) Negatively Correlated to Future Stock Market Returns!
What investors are actually doing with their money – acting out of fear or greed – is a better predictor of future stock market returns than even Buffett’s favorite, and highly touted, total market capitalization-to-GNP valuation measure. How do we use this information as a contrary indicator? How do we put it into practice? Read on. Read More »
9. Look Out Below? Buffett Market Indicator Has Now Surpassed 2007 Level
Market Cap to GDP is a long-term valuation indicator that has become popular in recent years, thanks to Warren Buffett and it is now at the second highest level in the past 60 years – even surpassing the levels reached in 2007. Read More »
10. Warren Buffett’s Favorite Valuation Metric Suggests Stock Market Is OVERvalued by 15%
Here’s some perspective on the potential value of the U.S. equity market using Warren Buffett’s favorite valuation metric – total stock market capitalization relative to GDP. Read More »
11. Buffett’s Measure of Stock Market Health, the TMC-to-GNP Ratio, Conveys Concerns
Buffett’s measure – the percentage of total market cap (TMC) relative to the U.S. GNP crossed 100% last week into stretched territory for the first time since 2007 which implies a mere return of around 3.3% annualized (including dividends) over the following years. [This post presents the components of the ratio and the conclusions drawn.] Read More »
12. Average Joe Investors Underperform the Market – Here’s Why
Over the past 20 years, the S&P 500 has produced a 9.2% annualized total return. Over the same period, gold has returned an annualized 6.6%. And bonds? The Barclays U.S. Aggregate Bond Index has returned 5.7%. Based on these figures, what type of return do you think the average investor has achieved over this time period? The answer will shock you. Read on! Read More »
 munKNEE.com Your Key to Making Money


