How does the current behavior of the global financial markets compare with the two recent crises, namely the great financial crisis of 2008/2009 and the minor one in 2010 when the sovereign debt crisis in the eurozone developed? [I have analyzed 15 aspects of the markets and have concluded that over the next 2/3 months we should see, among other things, increased volatility, declining S&P 500 and MSCI World indices, a bottoming in the 10-year U.S. Treasuries yield, renewed U.S. dollar weakness, renewed strength in the price of gold and silver with silver outperforming that of gold. Take a look at the 19 charts below to see for yourself.] Words: 825
I have charted the series starting with two months before each crisis developed and ended the series 11 months later. The respective series are as follows:
- 2008 crisis: July 2008 to July 2009
- 2010 crisis: February 2010 to February 2011
- 2011 crisis: from May 2011
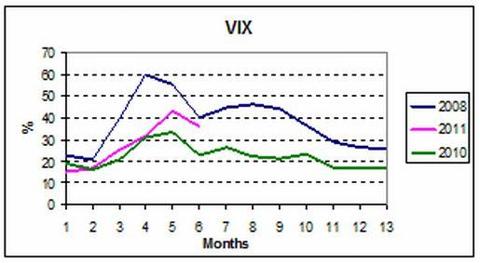
1. CBOE S&P 500 Volatility Index
The VIX is following the same trend as in the 2008 crisis. It is likely to rise again before stabilizing.
click on all charts to enlarge
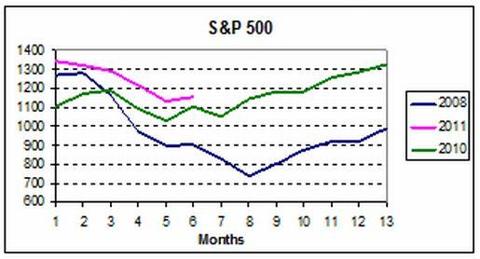
2. S&P 500 Index
The trend is similar to that of the 2008 and 2010 crises but milder and in line with 2010. The Index is likely to dip again in November, with a major threat of a deep sell-off in December.
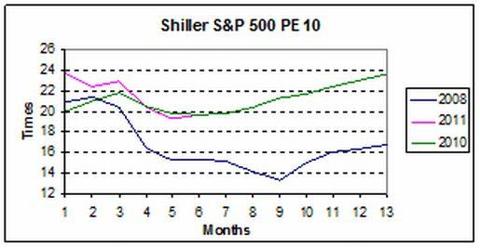
3. Shiller S&P 500 PE10
The declining trend follows that of the 2010 crisis and is about to stabilize. There is a major threat of a drop in December if 2008’s trend repeats itself.
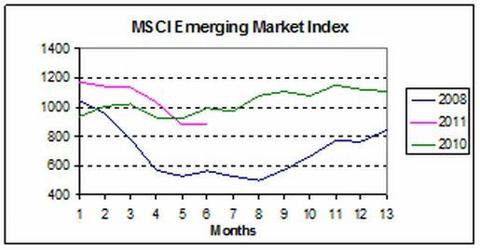
4. MSCI Emerging Market Index
The declining trend follows that of the 2008 crisis but is milder. Further weakening is possible over the next two months.
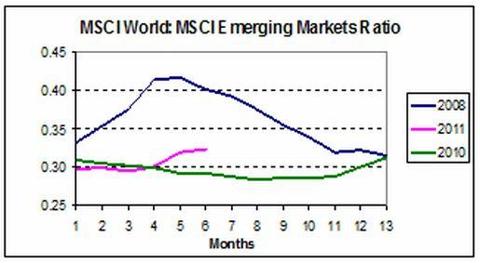
5. MSCI World:Emerging Market Ratio
The trend follows that of the 2008 crisis. Emerging markets are likely to outperform mature markets in coming months.
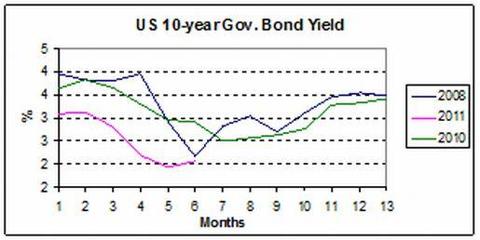
6. Yield on U.S. 10-year Treasury Note
The current trend is in line with both the 2008 and 2010 crises. The yield has either bottomed or will bottom in November.
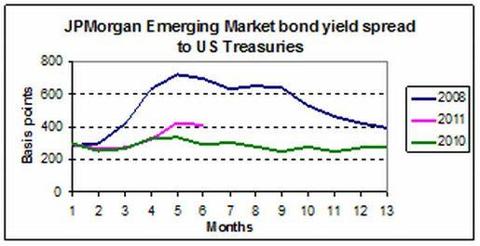
7. Emerging Market Yield Spread
Trend is in line with that of previous crises. The spread between emerging-market bonds and U.S. Treasuries has peaked and is about to decline soon.
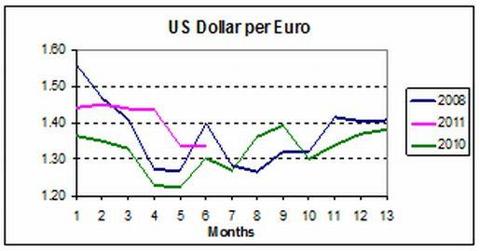
8. U.S. dollar per euro
The current trend lags that of previous crises by about a month. Dollar weakness is likely in November or December.
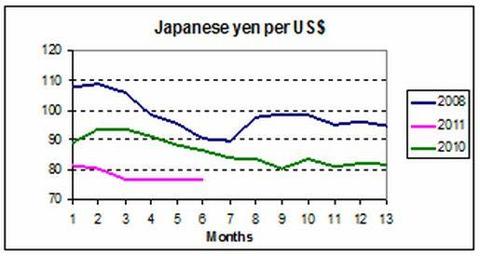
9. Yen per U.S. dollar
The current trend initially started off in line with that of previous crises but probable currency intervention prevented further strength of the yen. The stability of the yen against the dollar is likely to continue.
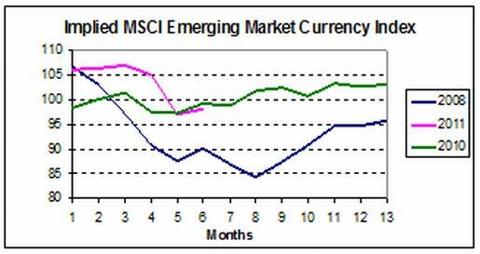
10. Emerging-market currencies
My implied emerging-market currency index is calculated by dividing the MSCI Emerging Market Index by the same Index in local currency terms. The Index was initially behind the trends of the previous cycles but caught up recently. While emerging-market currencies are likely to stabilize against the U.S. dollar there is a threat of a major weakening in November and December.
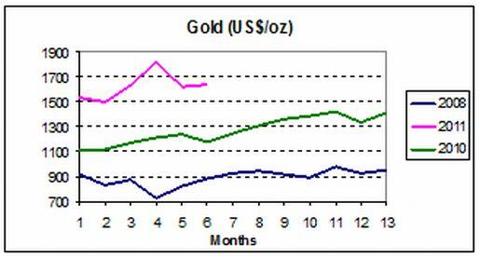
11. Gold price (US$/oz)
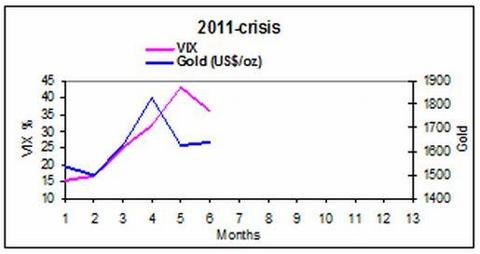
Gold’s trend is in line with that of the crisis in 2008 but stronger.
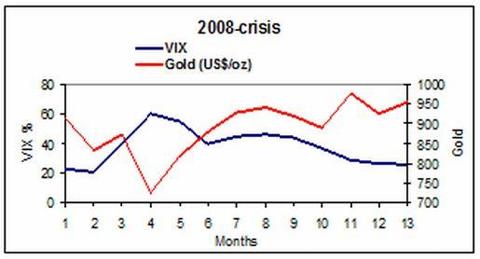
The sell-off in gold in the current crisis mirrors the sell-off during the 2008 crisis. In 2008 the sell-off coincided with the peak in volatilities in financial markets as measured by the VIX. Is gold telling us that the angst in financial markets is likely to be over soon? If so, then gold is likely to resume its upward trend.
12. The platinum-to-gold spread
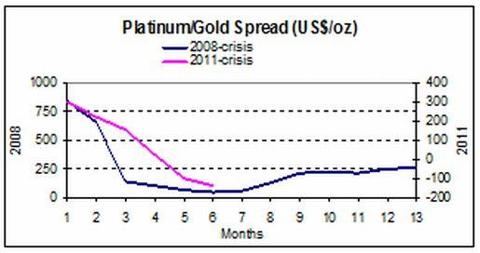
The spread currently follows the same trend as that during the 2008 crisis. If 2008’s trend is repeated, the current spread is bottoming and likely to rise in coming months.
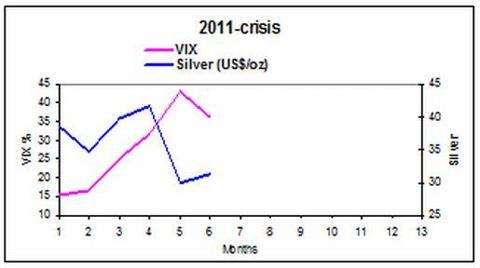
13. Silver (US$/oz)
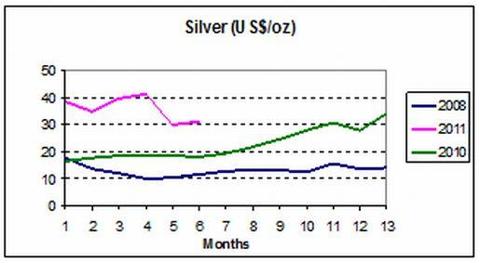
The silver price was unmoved by the 2010 crisis. As in the case of gold the silver price initially held up well during the current crisis.
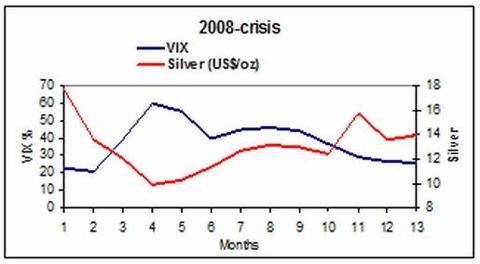
Silver also eventually succumbed to the crisis as it did during the 2008 crisis and fell heavily when volatility in financial markets rose substantially. Silver bottomed during the 2008 crisis when volatility in financial markets peaked. Is silver also telling us that the extreme volatilities are likely to subside soon? If so, then silver is about to resume its upward trend.
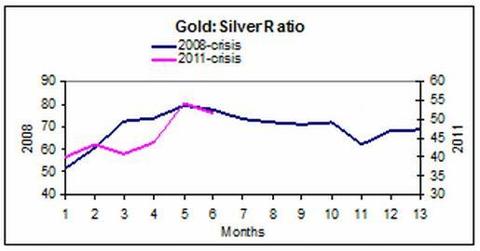
14. Gold/Silver Ratio
The ratio is following a similar trend to that during the 2008 crisis.The ratio can be expected to trend downwards over coming months. Silver is therefore expected to outperform gold.
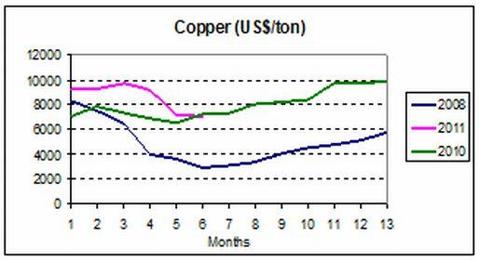
15. Copper (US$/ton)
Copper is following trends similar to those during the previous crisis and especially the 2008 crisis. If the trend during the 2008 crisis is repeated, the copper price is likely to decline further in November before heading north afterwards.
Sources: Robert Shiller; CBOE; I-Net Bridge; Plexus Asset Management.
Who in the world is currently reading this article along with you? Click here to find out.
*http://www.investmentpostcards.com/2011/10/11/crisis-chartbook/
 munKNEE.com Your Key to Making Money
