…Volatility has now returned to the stock market after a hibernation of several years…[and such] an explosion of volatility is indicative of a change of trend. The recent signals transmitted by this market have been classic and have been telling us that we have entered the final topping process of this extended and stretched economic cycle.
The original article has been edited here for length (…) and clarity ([ ]) by munKNEE.com – a Site For Sore Eyes & Inquisitive Minds – to provide a fast & easy read.
After putting in 15 consecutive months of higher lows and two years of closes above the stock market’s 50-week moving average it began to feel like the market would never go down again. After prolonged rises such as this when a correction finally comes around it can unfold quite violently as this one indeed has. Most investors actually have no idea just how extended this market had become…We now see the resolution of the current throw-over is shaping up like others in the past.
1929 Throw-over Top
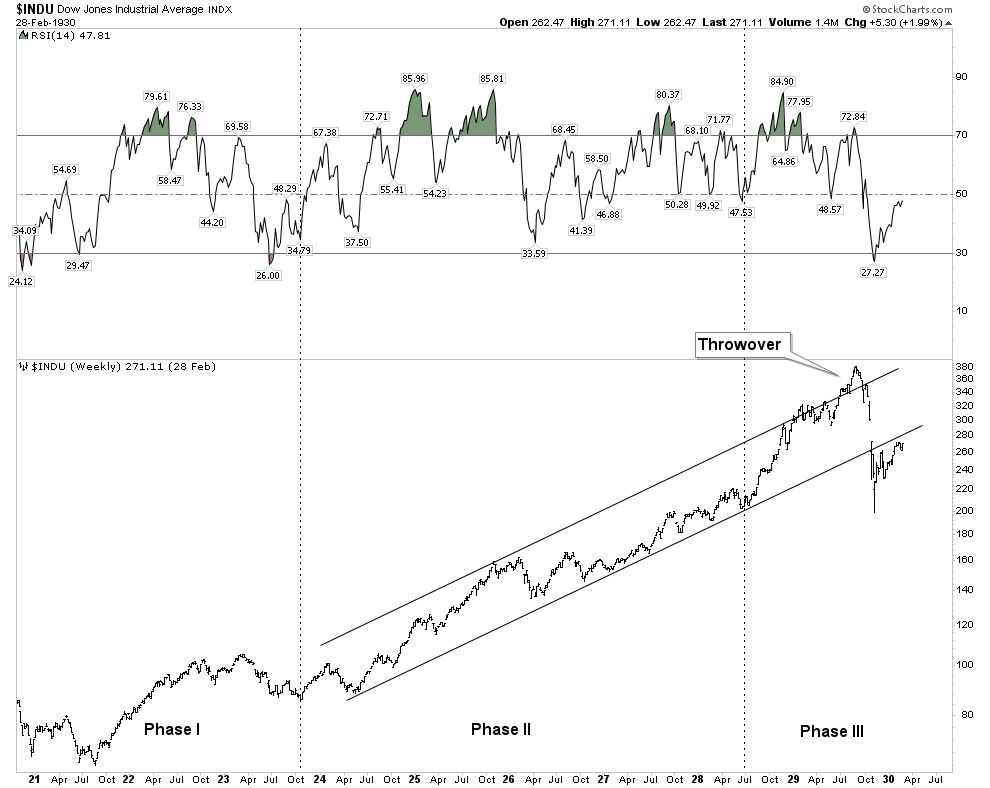
Note how in 1929 RSI [Read:Technically Speaking: What Exactly Is “RSI?”] peaked at the beginning of the year and the market was able to continue to advance until Sept 1929. This argues that today’s market should eventually be able to regroup and make a renewed assault at the existing highs. No guarantees that it will, but in the past momentum has peaked before price, not with price..
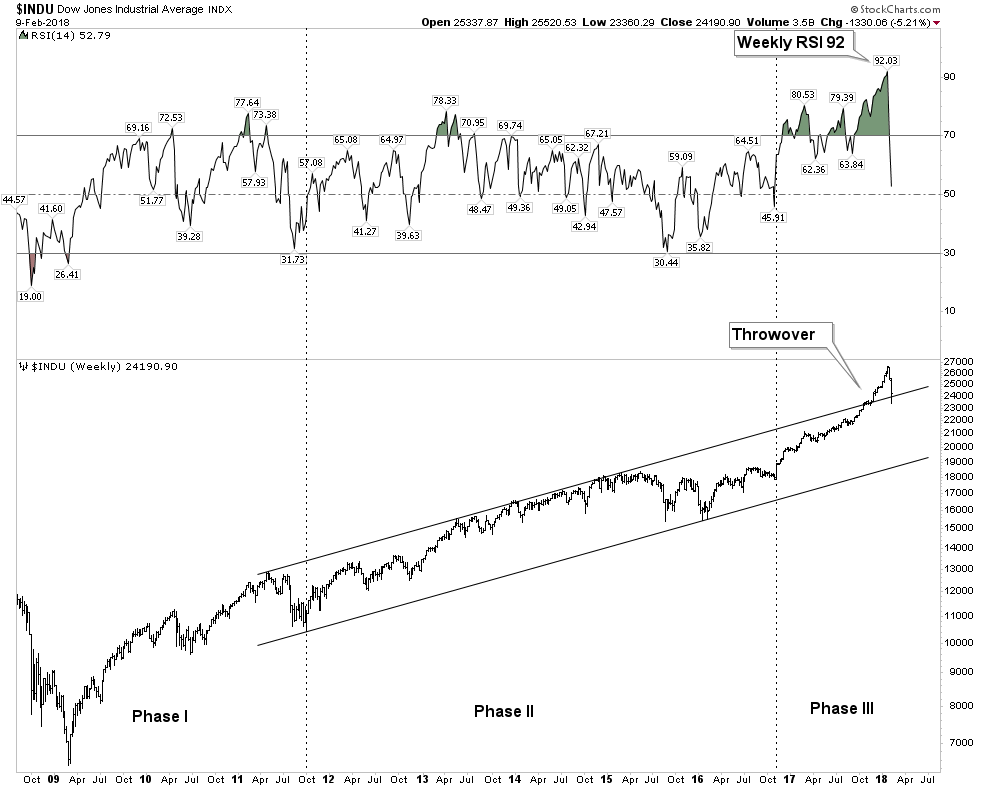
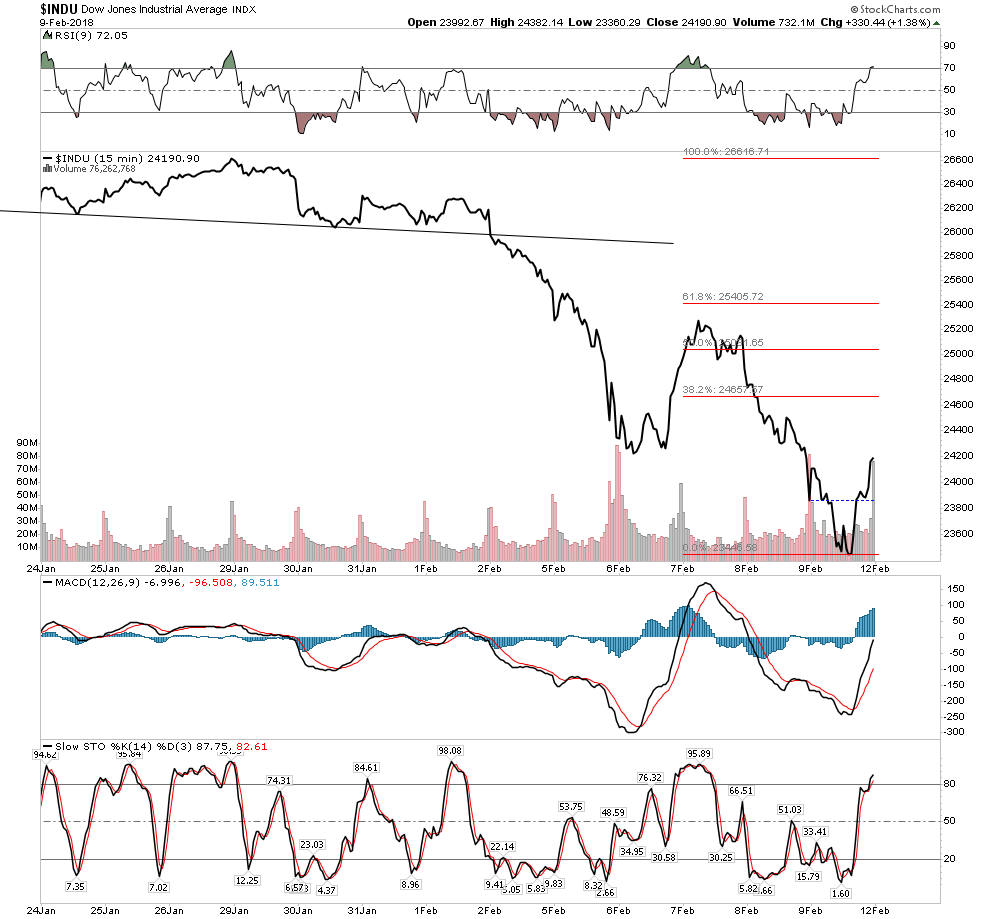
2018 Throw-over Top
It is important that price immediately close up above the upper trend line or the 1929 example could develop. There is so much residual momentum in this market that it could resume its march back up towards its January highs.
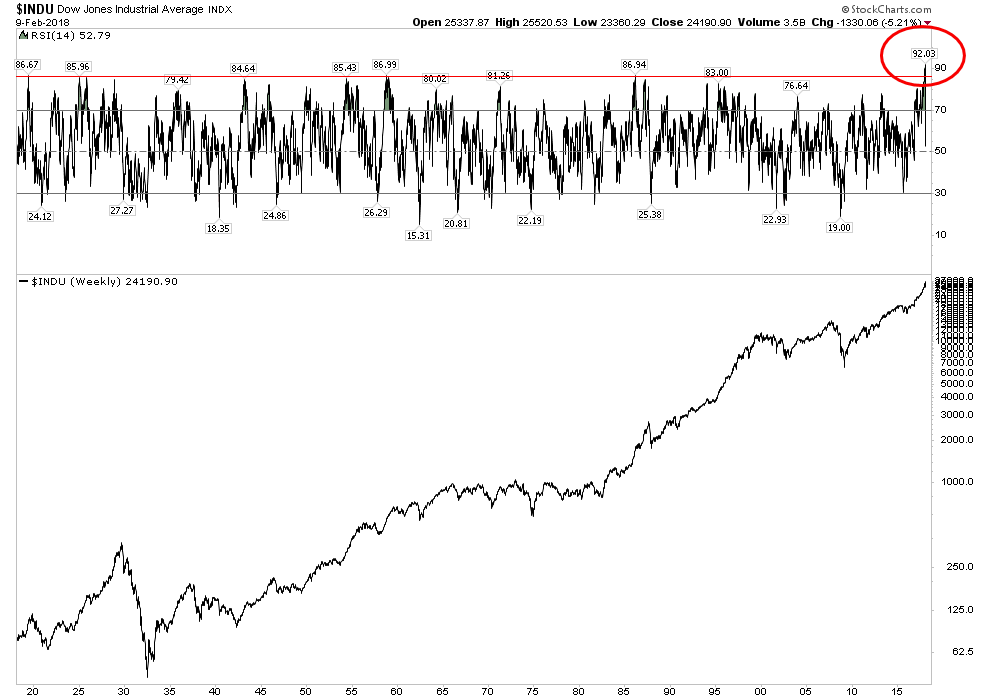
Upside Momentum- Just How Crazy it Had Become
When reviewing the RSI of this market it simply had become insane. How crazy? 100 year flood plain crazy. The chart below shows how ridiculous the upside thrust of the last few months had become. Weekly RSI had reached 94 – that is simply INSANE. The NASDAQ back in the Dot-Com mania only reached 84 and surely you remember how nuts that was. [Read: Your Guide To Surviving Volatility In The Stock Market]
The Phase III mania top
What we just experienced over the past 3-6 months was a phase III mania top. It fully expressed itself in the throw-over. [Read: Minsky’s 5 Stages of a Bubble – Where Are We Now?]
- The retail public finally came in and threw caution to the wind. It is the final bull run that excites the imagination, however precious little money is made from entering the market at these times, but the bull mania is contagious and it is precisely these times that lambs rush to the marketplace and of course eventually to the slaughter.
- No money is made, or at least banked in the climatic months of a great bull episode. Serious money is coined by purchases made in bad times, not by chasing fading rainbows of a mature advance but that is just what we witnessed. Just as winter follows summer, bear markets follow bull markets and the seasons continue…
The Structure of Panic
A typical panic will have at least 4 hard down days with a 1-2 day relief rally in the middle of the down sequence.
- The pressure relief day typically comes after the second hard down day.
- The decline then resumes and the 3rd down day is typically the scariest.
- Finally during the 4th hard down day within the panic period an upside reversal occurs and the panic is over.
This “typical” model…is precisely what actually unfolded. Since 1000 point swings in the DOW have characterized this panic, one could continue to expect after shocks, however I believe the worst is over and buy the dip muscle memory will now come in. The buy the dip habit wont go away until well into phase II of the bear after plungers have been burned enough to say “no mas”.
In the current action note below the described classic sequence with the pressure relief day. Also note the positive divergence in the RSI hinting it may be over:
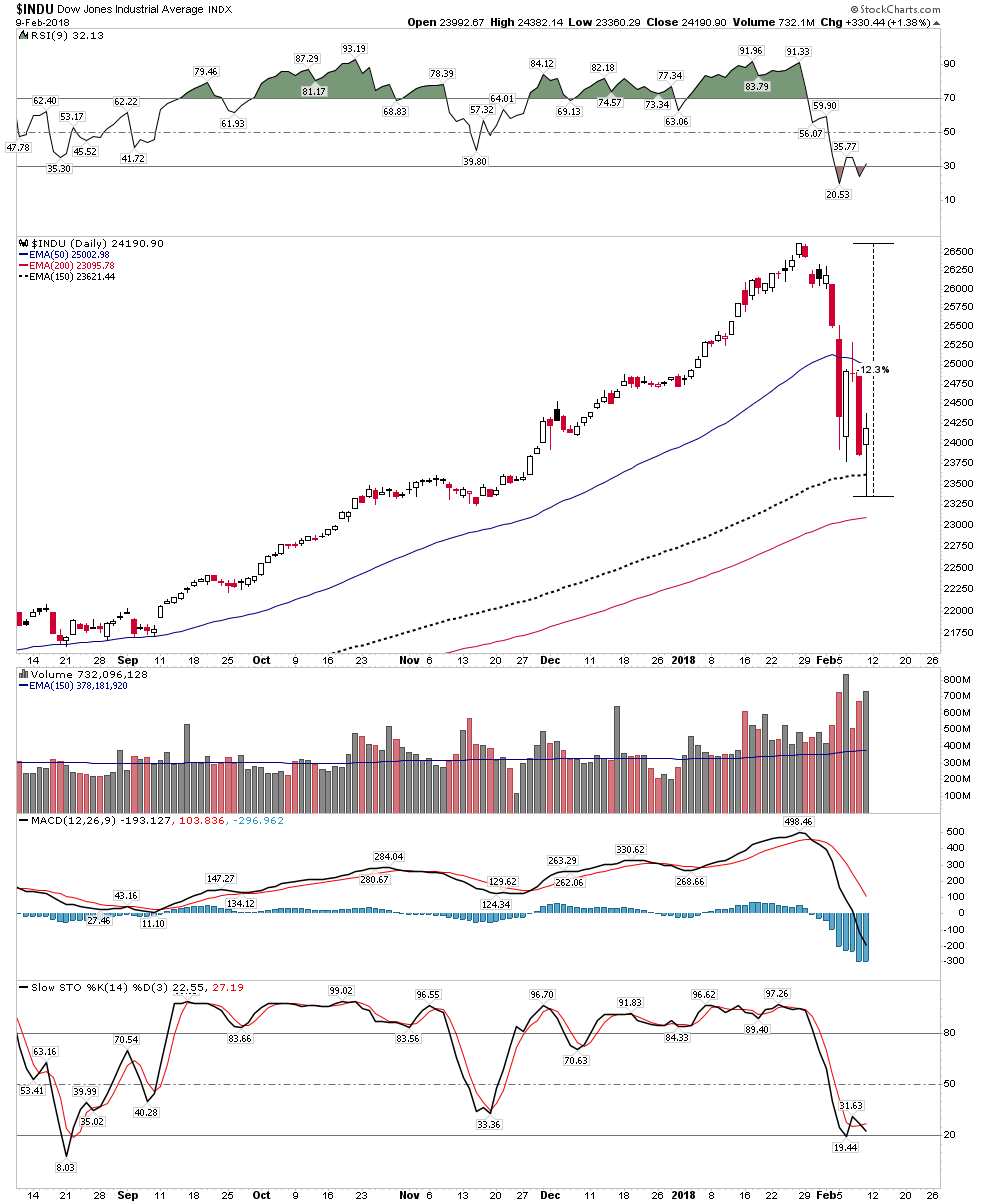
Below we see the extreme Down vs Up Volume bar on the bottom indicator which usually means a reversal is imminent:

The line chart shows a fledgling inverse H&S bottom starting to build out.
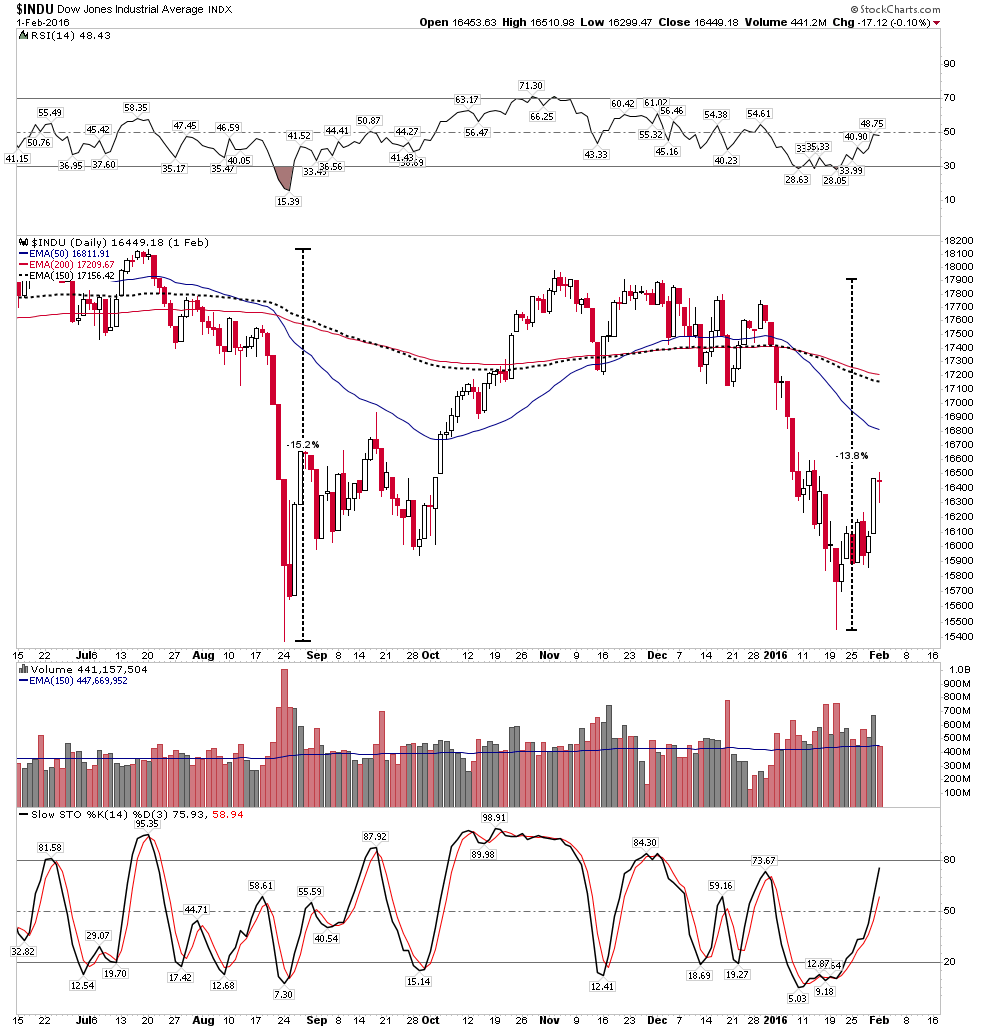
Below we see three past examples of violent froth removing corrections which did not closely follow the classic model. Their amplitudes were slightly larger than the current correction.
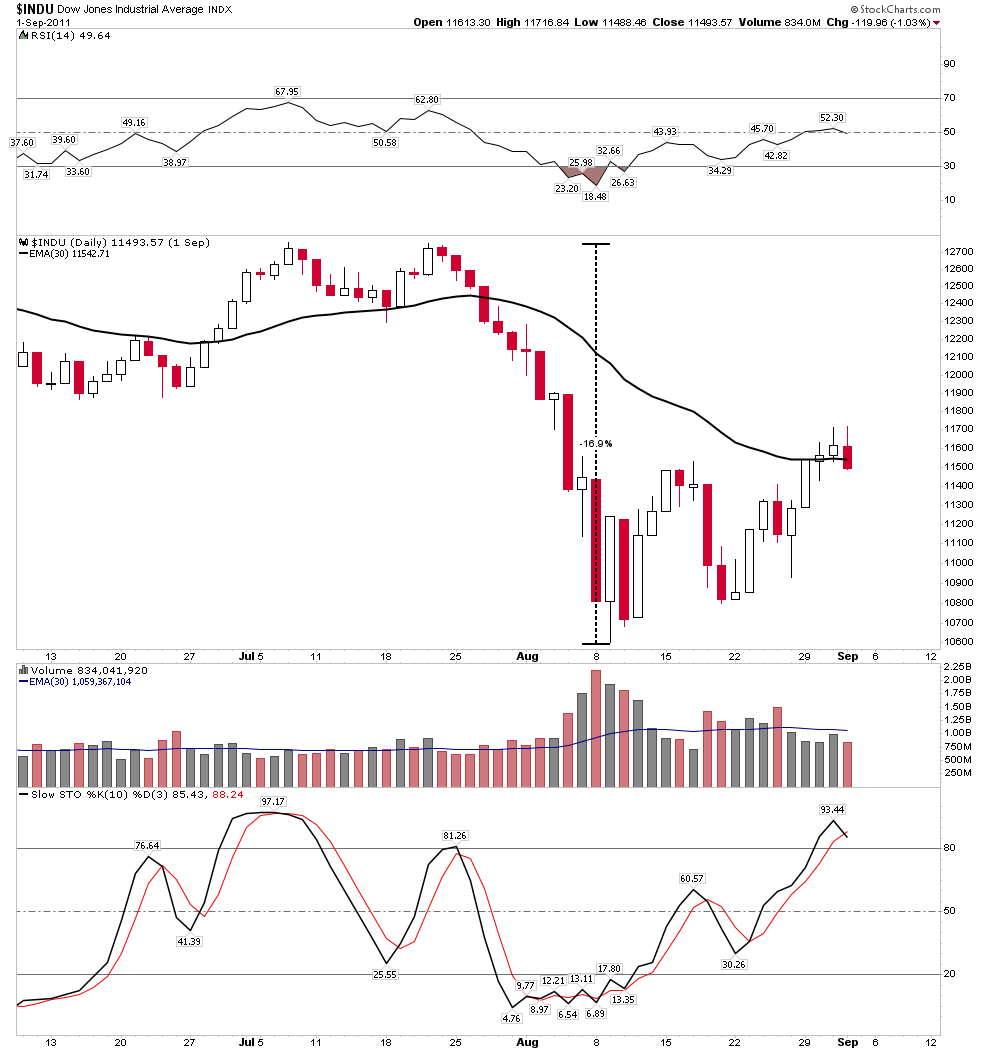
Two in a row:
The trading over the past 7 market sessions fit a classic pattern of market panic which corrects the excesses of a market which just completed an upside climax and had been without correction for close to two years. I believe this panic is now over and the muscle memory of buy the dip will now reassert itself. That, however, does not mean good times will continue as the froth has now been blown off of the bubble…[Read: Should You Sell Your Losing Stocks?]
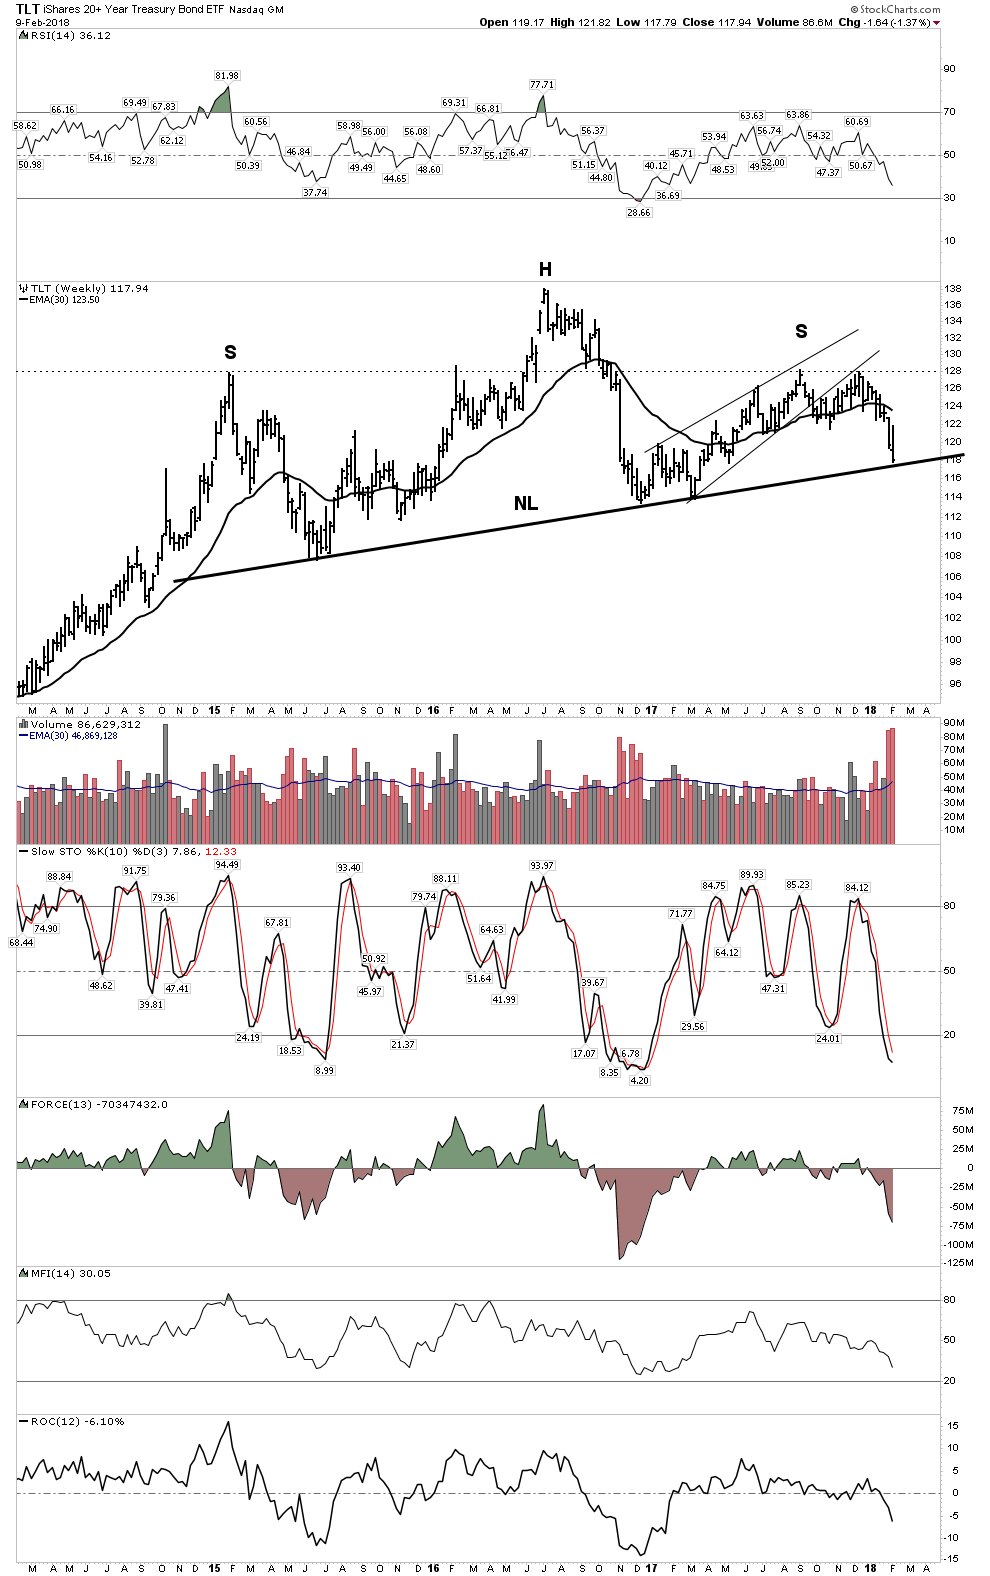
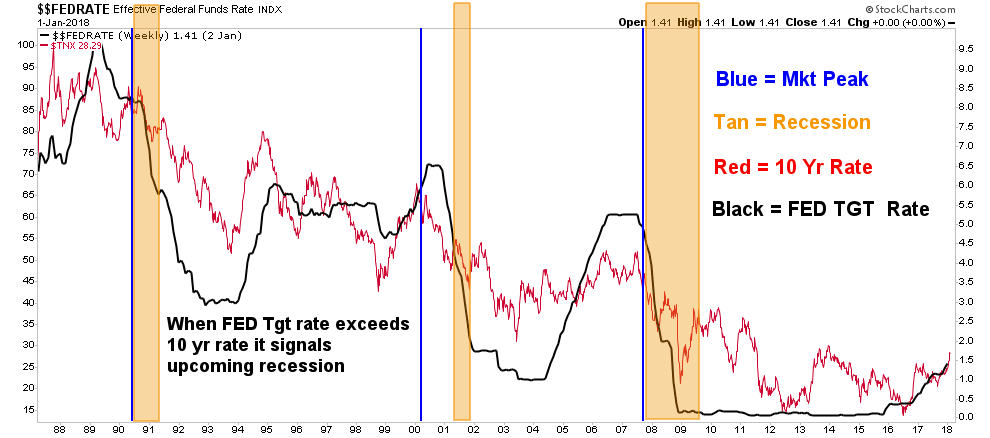
Interest Rate Indicators
The everything bubble is supported by depression level interest rates. Without these rock bottom rates the bubble would implode upon itself. As rates go down long term cash flows become more valuable. This encourages long term investment which depends on these lower rates. Once rates begin to rise these projects become marginalized and uneconomic. This triggers the recession. The TLT appears at a critical juncture. If it violates its neckline mayhem will break out in the market and the economy.
The risk now is the monetary alchemy going on in Washington. Tax cuts combined with increased spending fly in the face of reduced treasury purchases by the FED, China and Japan. That’s a recipe for higher rates. [Read: Are Interest Rates “going up for the right reason” OR Is This Narrative Just One More Bullshit Line From A Desperate Industry Of Commission-takers?]
The Economy is headed for good old fashioned– YIELD SHOCK
…The pin is higher rates. Back in February 1928 the FED began raising rates and finally succeeded in bursting the bubble in September 1929. Our FED has been slowly raising rates for 2 years now and what we saw last week was the pin coming in contact with the bubble. In addition to rising rates, the FED is on track to withdraw $1Trillion out of the economy over the next year- Hold on as that’s called Quantitative Tightening.
The interest rate indicators below suggest that the recession still remains off into the future. Using the past as a guide these charts indicate not until late this year or 2019.
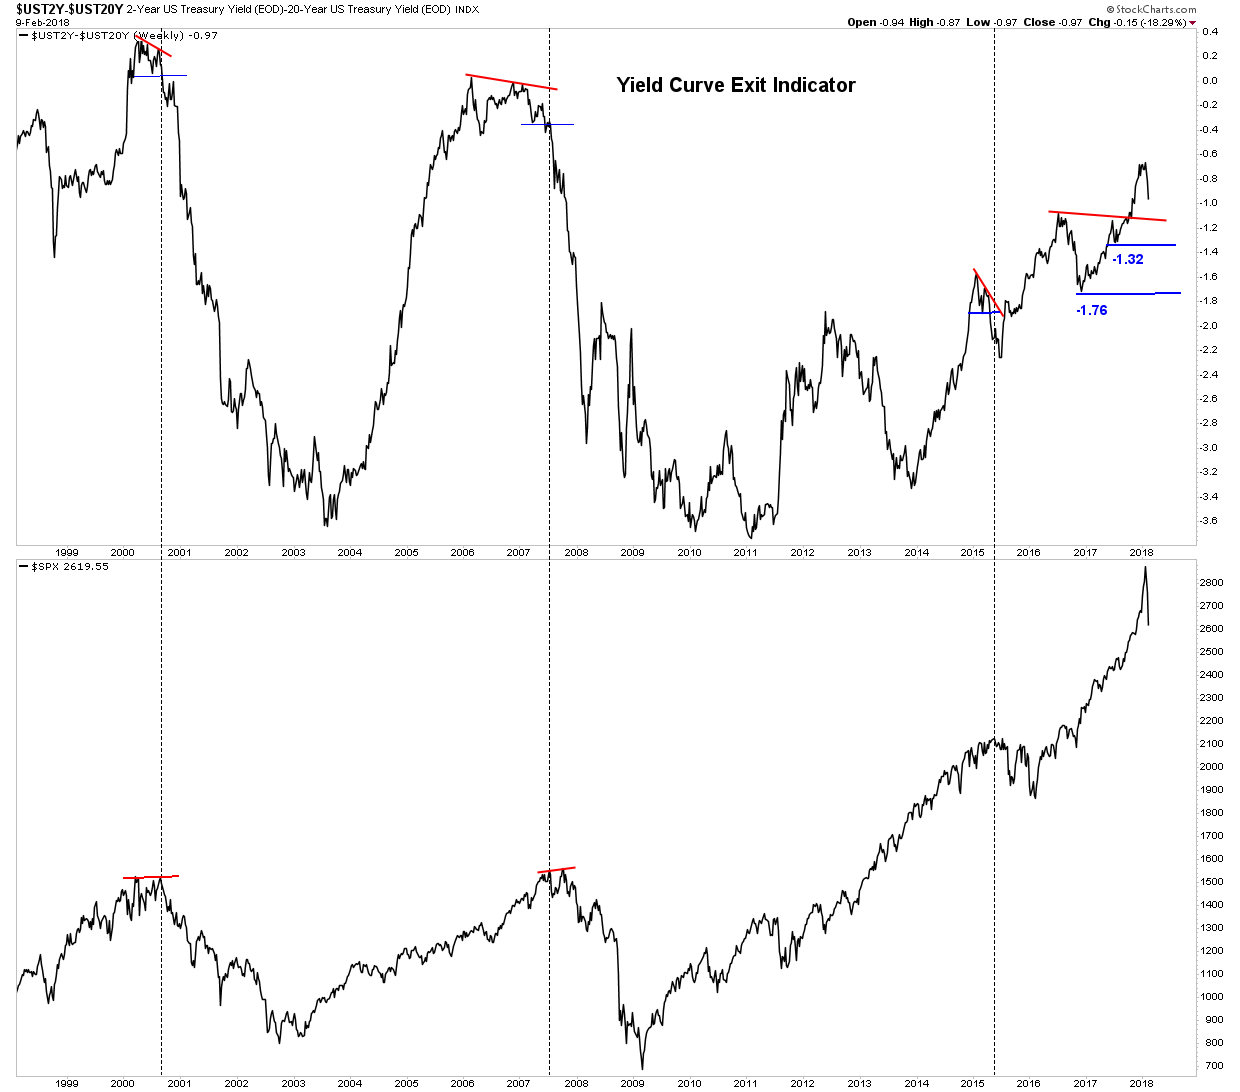
Interest rate spreads

The exit indicator below is saying NOT to exit the market at this time as the sell signal comes in at 1.32.
In Summary:
This has been a great week…because…we know where we are now within the bull/bear cycle. We are in the end zone. The market going up relentlessly every day over the past 3 months was disconcerting and nuts.
The over throw tells us it was a speculative blow off, an upside climax. Climaxes can’t last forever and it finally met reality… that’s good, gravity finally asserted itself. The market can regroup and rise again, but this showed us the end is nigh. The froth of the everything bubble got blown off and if it does rally to its old high it will no longer have the juice nor conviction it had before.
Some investors who were hurt by this downdraft are now scared and will use the rally to escape partially intact. Recall that retiring baby boomers can’t afford to get crushed again and this correction serves to bring them back down to reality.
The ending process now can proceed. The market could still see higher highs, but it will become more narrow and the advance/decline will start to fade. [Read: The Advance-Decline (A-D) Line Shows Market Action BEFORE Significant Declines – Check It Out]The great thing is we know what comes next. Eventually the market succumbs to a ruthless bear market and the gold sector resumes its next phase of its bull.
Related Articles From the munKNEE Vault:
1. Your Guide To Surviving Volatility In The Stock Market
Overall, the market was due for a pullback. It seemed like every trading day in January, the market was only rising so it is only natural that, eventually, the market was going to fall but it’s just that many didn’t think this type of volatility was going to happen so soon. Here are some things to keep in mind.
Each time interest rates have surged up to their long-term trendline, a ‘crisis’ has occurred. Is this time really different because rates are “going up for the right reason” or is this narrative just one more bullshit line from a desperate industry of asset-gatherers and commission-takers?
3. Minsky’s 5 Stages of a Bubble – Where Are We Now?
In this article we review the characteristics and different stages of a bubble, present some recent asset price bubbles, and identify current conditions which match up with traditional bubble criteria.
4. The Advance-Decline (A-D) Line Shows Market Action BEFORE Significant Declines – Check It Out
Many of us think Wall Street is using sophisticated tools to make money. It is…but big Wall Street firms also use simple tools to make money. One tool many large firms use is the advance-decline line.
5. Technically Speaking: What Exactly Is “RSI?”
Exactly what is RSI and how is it calculated?
What do you do with your losing stocks? Unfortunately, many of us probably hold onto them, afraid to admit our failure with the hope that one-day they’ll come back. In this article, I’ll try to explain why it might make sense to sell them.
7. Investing In Equities Carries Substantial Risk: The S&P 500 Roller Coaster Of Returns
Imagine that five years ago you invested $10,000 in the S&P 500. How much would it be worth today, with dividends reinvested but adjusted for inflation?
8. Central Banks Are Going to Have to “Pull the Plug” on Stocks – Here’s Why
Take a look at what is happening in the bond markets which trade based on inflation in the real world. When inflation rises, bond yields rise and right now, sovereign bond yields are rising around the world.
9. Take Note: These 11 of 19 Bear Market Warnings Have Been Signaled Already
As you can see from the image below, 11 of the 19 bear market signposts have been triggered already. Here they are:
10. Is This the “Mother Of All Blow-Offs?” Probably
Is this the “Mother Of All Blow-Offs?” Probably. Historically, this is the type of market behavior which has marked the blow-off top of speculative manias and has proceeded serious market accidents. Chasing the price-momentum higher and waiting for a bigger idiot to buy shares from you works well until the music stops. Then everyone gets hurt.