…2017 provided many good times [but,] for worriers, the low volatility and steady gains of last year signal bad times are likely in 2018…[and] they have a point. It’s true that good times can’t last forever. [That being said,] it’s also true that we can spot when the good times have gone too far with this simple indicator.
The original article has been edited here for length (…) and clarity ([ ]) by munKNEE.com to provide a fast & easy read.
The chart below shows that indicator. It’s a simple 12-month rate of change (ROC).
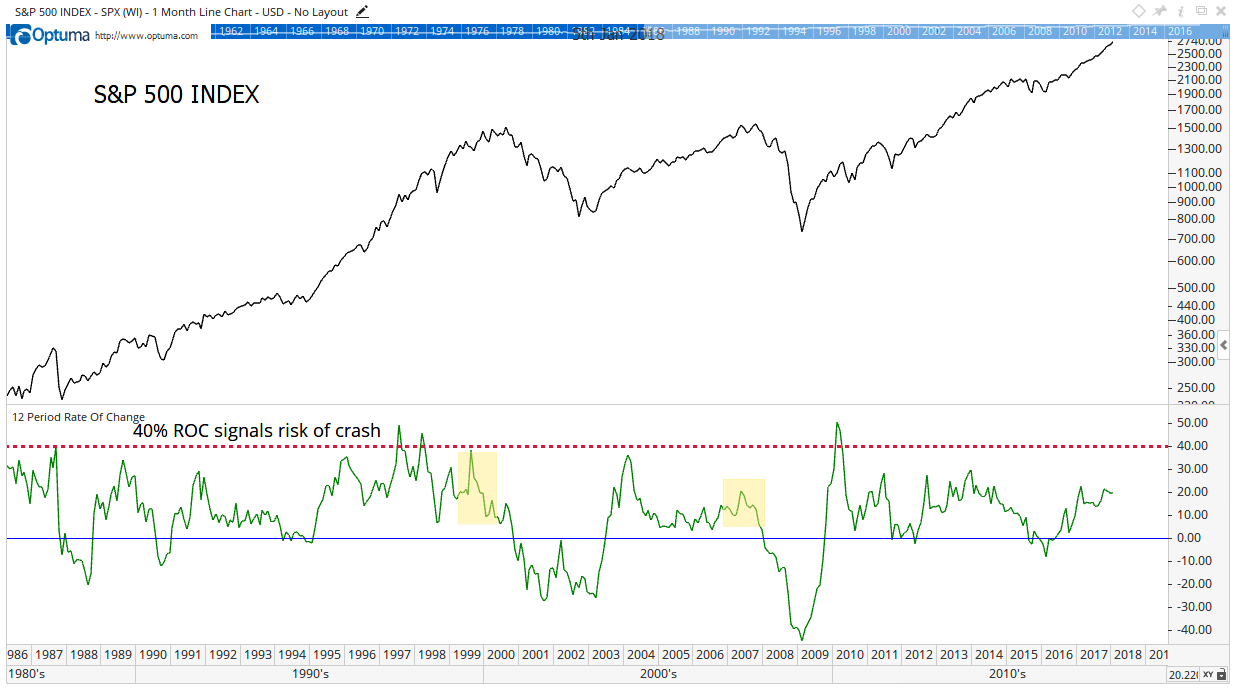
It measures the year-over-year change in price. The solid blue line is the zero level. Right now, the 12-month ROC sits just below 20%, indicating the index is up about 20% in the past year.
ROC tells us how fast the stock market is going. Just like on the highway, there’s a speed limit. In the stock market, the speed limit is about 40%.
- When stocks advance more than 40% in a year, a crash often follows. We are nowhere near crash levels.
- Bear markets, or a stock market decline of more than 20%, generally follow periods when the ROC is declining. Yellow boxes [in the chart above] highlight the last two bear markets. The indicator’s current pattern looks nothing like that.
- Sell-offs, or a stock market decline of more than 10%, generally occur after the ROC exceeds 25%. Technically, that level is about one standard deviation above average. When we move that far from average, something unusual is happening but, right now, we are under that level. That means, mathematically, there’s nothing unusual about the current market action.
That’s disappointing to bears who are looking for a market decline but that’s good news for the rest of us. Stock prices could move sharply higher from here.
For those who want to worry about the next market decline, the ROC indicator will tell us when to worry. Until then, we should enjoy the gains.