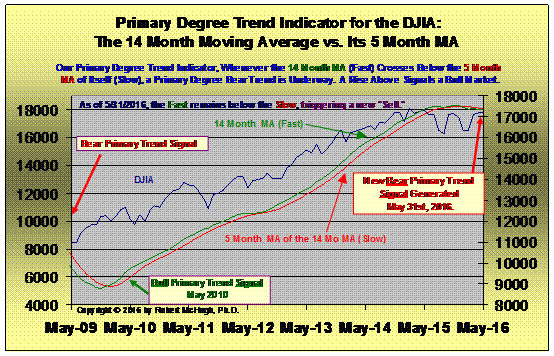
For the first time in six years, our Primary Trend Indicator, a long-term trend stock market forecaster, generated a new signal, a Sell Signal on May 31st, 2016. The last signal change was a Buy in May 2010. These long-term Buy and Sell signals are rare, but have been very accurate at identifying the start of new long-term trends. This is a warning that stocks are about to enter a long-term bear market, one that will likely be lengthy and deep.
An article (original) by Robert McHugh Ph.D. (technicalindicatorindex.com) which has been slightly edited ([ ]) and abridged (…) to provide a faster and easier read.
…The market’s behavior after previous “Buy” and “Sell” signals from this indicator…[are as follows]:
- The last time the PTI generated a new long-term trend “Sell” signal was almost eight years ago, on September 30th, 2008, just as the autumn stock market crash started…We saw a…41% decline after this sell signal was triggered.
- The previous signal was a “Buy” signal on October 31st, 2003, which was followed by a 4,130 point rally.
- The signal prior to that was a “Sell” signal in March 2001, which was followed by a 2,462 point decline.
…[From the above] you can see this is a very important long-term market trend forecaster with an incredible track record.

Here is how the Primary Trend Indicator works:
One of the tools we have in our arsenal to identify the status of a Primary Degree long-term trend is a simple analysis of the 14 month moving average versus a Slower moving average calculation, the 5 month MA of the 14 month. It has been terrific at identifying multi-year trends, both up and down.
- While it sometimes is a little late in generating the buy and sell signals, it triggered a “sell” near the start of Primary degree wave (4) down, in mid 2000. What followed was a two and a half year, 39% drop into the wave (4) bottom on October 10th, 2002.
- It took a while for this indicator to confirm that the rally that started on October 11th, 2002 would in fact be a multi-year primary degree wave up, wave (5) up but in October 2003, this analytical tool did in fact trigger a Primary Degree “Buy” signal, which led to a four year further rally to new all-time nominal highs on October 11th, 2007 at 14,198.
- We require a 5 month moving average of the Spread between the Fast and Slow to reverse in a new direction for 3 consecutive months in order to declare that a new primary trend, a new multi-year trend, is underway. To generate the previous Buy signal back in May 2010, the spread between the Fast and the Slow went positive in January 2010 for the first time in 20 months. March 2010 generated the first of the three required consecutive positive readings in the 5 month moving average for a long-term Buy signal, April 2010 generated the second, and May 2010 generated the third, when a new Buy signal was triggered six years ago.
- However, the spread fell to negative – 49 on January 31st, 2016, and was followed by negative spread levels each month since, creating a new long-term Sell signal as of May 31st, 2016, when our PTI is now on a “Sell.”
There had been only four signals since 1997 before the Sell signal in May 2016, so this tool is useful for long-term investors, as it filters out the noise of up and down corrections of significance in favor of the primary trend. September 2008 was the third signal, May 2010’s was the fourth, and the May 2016 signal is the fifth.
This Sell signal confirms that the Economic Ice Age is starting…
 munKNEE.com Your Key to Making Money
