Are the general stock markets and precious metals and precious metals equities  about to experience a reversal in fortunes? Based upon current evidence, I think so…
The above comments are edited excerpts from an article* by Ian Gordon (longwavegroup.com) as posted on Gold-Eagle.com under the title Stock Markets Versus Gold presented here on munKNEE.com in a 2-part series. (See Part 2 here).
The following article is presented courtesy of Lorimer Wilson, editor of www.munKNEE.com (Your Key to Making Money!) and has been edited, abridged and/or reformatted (some sub-titles and bold/italics emphases) for the sake of clarity and brevity to ensure a fast and easy read. This paragraph must be included in any article re-posting to avoid copyright infringement.
Gordon goes on to say in further edited excerpts:
At this time, the general stock market is a position of extreme strength and gold and gold stocks are displaying extreme weakness.
- The S & P 500 has been bullish since March 2009 and since that bear market low the Index has increased in value by 200% (the DJIA has made an average daily gain of 5.44 points).
- Gold and gold stocks have been in a bear market since September 2011…
- Gold is currently priced at about $1,320.00 (U.S.) per ounce down a little more than 30% from $1,920.00 (U.S.) per ounce.
- the current value of the HUI (Gold Bugs Index) is close to 240, which is down a whopping 62.50% from that existing record high level of 638.59…
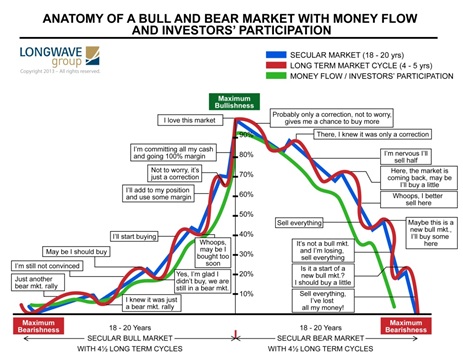
What…[the above] means is [that,] after long term and major price moves in either direction, the market will turn in the opposite direction because:
- everyone who wants to buy into the market is already invested and there is no one left to buy.
- and once prices turn down the margin clerks issue margin calls…generally answered by sell instructions…[which] increases selling…

Extreme Bullishness
The fact that U.S. stock prices have been bullish since March 2009, and since then have increased in value by at least 200%, means that we are a point of extreme bullishness where investors have thrown all caution to the wind.
The latest Elliott Wave Financial Forecast, July 3, 2014, cites several examples of this extreme level of bullishness which are now pervading the stock market….”Nothing exhilarates the bulls at a peak in stock prices like forecasts calling for magnificent new gains in the future. In 1999 and 2000, books such as Dow 36,000 and Dow 100,000 rolled off of the presses.
June 2014 brought…[the following headlines]:
- ‘The Greatest Bull Market in 85 years” (CNBC, 6/8/14),
- “Dow 20,000” (NASDAQ. COM, 6/18/14) and
- “Why Dow 44,000 Is Coming” from Yahoo Finance…[which] predicts another ten years of outsized returns, to the tune of 10.5% per year, thus the Dow target. Bloomberg and the Financial Post featured the same scoop.
- The Wall Street Journal reported that ‘money managers and analysts are beginning to talk about a melt-up, a sudden double digit percentage rise.’ (It notes that this is a concern to some because ‘melt-ups can lead to melt-downs’.)
- A June 23 USA Today headline states “Few Want to Risk Taking Profits, Missing Gains,’ suggesting that investors are now literally afraid to be out of the market saying, it’s now ‘risky to take profits!’…
- An article in the Saturday, July 5, 2014, Globe and Mail headlined “All Aboard: This Rally Is Built to Last,” is based upon the premise that since most stocks are participating in the upward stock market price move, the bull market will continue [saying] “Individual stock pickers can be more optimistic on the prospects for smaller-cap, attractively valued stocks for as long as the trend of more stocks joining the party lasts…”
- Extreme Greed By the Crowd Suggests You Show Some Fear! Here’s Why
- 2 Stock Market Indicators Are Saying “Be careful, don’t get caught up in the euphoria”
Excessive Margin Debt
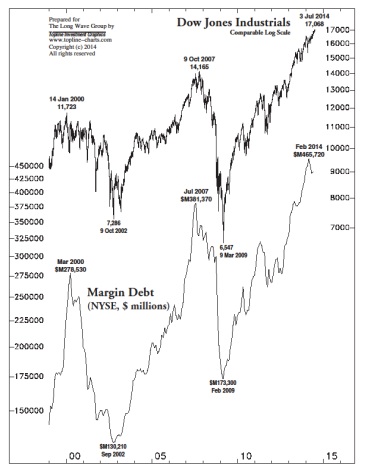
Margin debt, which is a measure of confidence in the stock market, is at record highs; at least it was until a couple of months ago. It is interesting to note that margin debt turned down before the market in 2000 and 2007 and that margin debt this year peaked in February and has since been reduced. Is the current downturn in margin debt from record levels signaling a new bear market as it has done in previous times?

Big IPO Premiums
U.S. IPOs (Initial Public Offerings) for the first half of 2014 are experiencing their biggest premium since 2000; you know what followed.
Increase in Mergers & Acquisitions
On June 30, 2014, the Wall Street Journal reported that so far this year there have been 20 merger deals valued at more than $10 billion (U.S.), which is the largest since the first half of 2007 and you know what followed.
Market Cycles
Cycles are also suggesting that the peak in stock prices is near and is more than likely to occur sometime in 2014.
- Cycle Analysis Suggests S&P 500 Has Topped & Will Decline To Major Low In 2016
- These 20 Cycle Theories Suggest Stock Markets, Gold & Bonds To Severely Correct
- Are We In Phase 3 – the Final Phase – of This Bull Market Yet?
W. D. Gann, the great cycle proponent and highly successful trader, wrote that the number 7 was a tragic number…There are two different number 7s associated with the stock market this year.
- in numerology terms the year 2014 is equal to seven, 2+0+1+4=7…
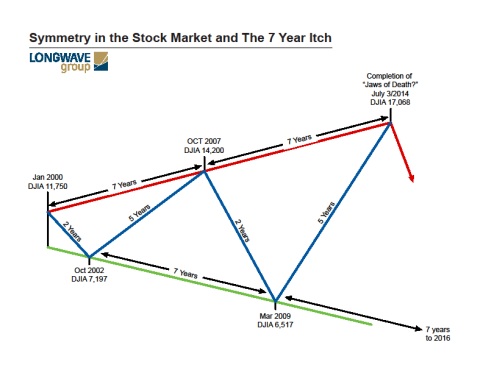
- the year 2014 is 7 years beyond the previous bull market peak in 2007. That bull market peak was itself 7 years beyond the 2000 bull market price peak. The two bear market lows 2002 and 2009 were also 7 years apart.
Below I show a stylized version of the bull and bear markets since great autumn stock bull market ended in 2000. Note the beautiful symmetry, which is an important feature of cycle analysis.

Each bear market lasts approximately 2 years. The bull market 2002 to 2007 lasted 5 years and the current bull market is well into its fifth year. The numbers 2 and 5 are Fibonacci numbers and these numbers are used extensively in technical analysis and in particular in Elliott Wave analysis.
Gann also drew high importance to the number 49, (7 X7), which he stated was the jubilee number and a number that signifies important market price turns. The year 2015, next year, just so happens to be 49 years from 1966, which was the year in which spring and the spring stock bull market ended in the current long wave cycle. Thus, in the unlikely event that stock markets do not reach their bull market price peaks this year, they will almost certainly do that next year.
Fibonacci Numbers
“What are Fibonacci numbers? They are an incredible set of numbers that seem to rule markets, both in terms of distance and price moves and timing, and rule physics and art (and nature) throughout the universe.”
“The Fibonacci number sequence starts with the number one and then when it adds to itself it produces the next Fib number which would be 2(1+1), then if we take that resultant number and add it to the previous Fib number in the sequence, it produces the next Fib number, which would be 3 (2+1), then the next number is 3 + the previous number in this sequence which was 2 resulting in 5 (3 +2), then 8 (5+3), then 13 (8 + 5), then 21 (13 + 8), etc., which gets us the sequence 34, 55, 89, 144, 233, 377, 610, 987, 1597, 2584, etc.”
What is incredibly unique about this sequence is the two component numbers, when divided by their combined result, will approximate at the low end, and otherwise equal either .382 or .618. The ratio .618 is known as phi. For example, for the Fibonacci number 21, its two components are 13 and 8. If we divide 13 into 21, 13/21 = .618 and 8/21= .382. The larger the numbers the more precise they come to .382 and .618.” Robert McHugh. (Note the symmetry)…
Jaws of Death
One other thing to note is what Dr. Robert McHugh calls the ‘Jaws of Death’ or the megaphone pattern may be complete. “The industrials have essentially reached the upper boundary of the Jaws of Death pattern, the top for Grand Super cycle degree wave (111) up. It suggests the Industrials could rally toward 17,000ish (they did, closing at 17, 068 on July 3, 2014) at the conclusion of wave c-up and e-up, but by reaching a high of 16,588.25 on December 31, 2013, it is close enough for pattern completion. The decline since December 31, 2013 may suggest the pattern is finished and the coming economic ice age has started.” McHugh’s Market Forecast & Trading Report, Thursday, July 3, 2014, P. 30.
Economic Ice Age
[As identified above] there is a large amount of evidence which suggests the stock bull market is either finished or close to a finish. The bear market that follows will be one for the ages. It will make the bear markets of 2000- 2002 and 2007-2009 appear like minor glitches. I am sticking to my Dow 1,000 target. What that means is an ‘Economic Ice Age’, which just so happens to be the title of Dr. McHugh’s recently published book.
Editor’s Note: The author’s views and conclusions in the above article are unaltered and no personal comments have been included to maintain the integrity of the original post. Furthermore, the views, conclusions and any recommendations offered in this article are not to be construed as an endorsement of such by the editor.
*http://www.gold-eagle.com/article/stock-markets-versus-gold
Follow the munKNEE!
- Register for our Newsletter (sample here)
- Find us on Facebook
- Follow us on Twitter (#munknee)
- Subscribe via RSS
Related Articles:
1. Bradley Model Suggests Major Turning Point In Stock Market Is Imminent
Back in the 1940s Donald Bradley developed a means to forecast the stock market using the movement of the planets which, according to the noted technical analyst William Eng in his book Technical Analysis of Stocks, Options, and Futures, is the only ‘excellent’ Timing Indicator. Below are current Bradley timing model charts indicating a major turning point in the stock markets is imminent. Read More »
2. Cycle Analysis Suggests S&P 500 Has Topped & Will Decline To Major Low In 2016
While the majority is looking at the Megaphone Pattern correction since the 2000 high and is expecting the market to go back to the lower trend line of this pattern and to make new lows, I think that it will not happen. The opinion of the majority can be used as a contrarian indicator. I think that a healthy correction in this new Secular Bull Market could push the Dow Jones to 12500-13500 (end of 2015 – half 2016) followed by a second leg up of this new Secular Bull Market. Read More »
3. These 20 Cycle Theories Suggest Stock Markets, Gold & Bonds To Severely Correct
Unsustainable trends can survive much longer than most people anticipate, but they do end when their “time is up” – at the culmination of their time cycles…In an effort to bring clarity in how and when these trends could change direction we analyzed more than 20 different cycles. They almost unanimously point to tectonic shifts in the months and years ahead … starting now. We have been warned. At this point, we have enough confirmation to accept that the gold and silver crash – starting in April of 2013 – was the first shot across the board of what is to come. Read on! Read More »
4. Next Bear Market Shaping Up To Be Quite the Storm – Here’s Why
The U.S. stock market has been closing at one record high after another but, despite the seemingly unending investor optimism more than five years into the current bull market, some worrisome issues are continuing to build under the surface. Like all past bull markets, the latest episode will eventually come to an end and a new bear market will begin and it has the potential to be even worse than the two previous downturns since the start of the new millennium… Read More »
5. EXPECT & PLAN For A Major Stock Market Correction In the Coming Weeks/Months – Here’s Why & How
The S&P 500 is now up over 180% since troughing in March 2009 and it has been almost 3 years since the stock market experienced a 10% correction. Historically, market corrections happen approximately every 2 years on average. [As such,] we think that this rally is getting very long in the tooth and we wouldn’t be surprised if we have a healthy pullback in the coming weeks or months. Read More »
6. Extreme Greed By the Crowd Suggests You Show Some Fear! Here’s Why
Greed may have been good for Gordon Gekko. but in the investment world it rarely is. As Warren Buffett is famous for saying “…be fearful when others are greedy and greedy when others are fearful” [and now is such a time]…to start showing some level of fear here in the face of extreme greed by the crowd. The crowd can be right for a long time, but they are rarely right at extremes. While this time may be different, the probabilities suggest that at the very least it will be a more difficult environment for equities going forward.
7. Make No Mistake – A Major Stock Sell-off Looms! Here Are 4 Ominous Signs
The 4 fundamentals and technicals discussed in this article accurately called stock market crashes in 2000 and 2007 and these same market metrics are again TODAY warning that a possible financial tsunami is brewing on the horizon. No one knows for certain WHEN the tsunami will hit Wall Street…but, without question, today’s stocks exhibit extremely exaggerated valuations, and extremes never last, so make no mistake, a major stock sell-off looms.
8. These Indicators Should Scare the Hell Out of Anyone With A Stock Portfolio
For US stocks — and by implication most other equity markets — the danger signals are piling up to the point where a case can be made that the end is, at last, near. Take a look at these examples of indicators that should scare the hell out of anyone with a big stock portfolio.
9. Are We In Phase 3 – the Final Phase – of This Bull Market Yet?
Are we in the third phase of a bull market? Most who will read this article will immediately say “no” but isn’t that what was always believed during the “mania” phase of every previous bull market cycle? With the current bull market now stretching into its sixth year; it seems appropriate to review the three very distinct phases of historical bull market cycles. Read More »
10. Margin Debt: It Doesn’t Matter ’til It Matters! Is Now the Time to Be Worried About the S&P 500?
It doesn’t matter until it matters! IF margin debt should start decreasing swiftly, history would suggest something different is taking place in the mind of aggressive investors. Will a decline in margin debt from all-time highs matter this time? Read More »
11. 2 Stock Market Indicators Are Saying “Be careful, don’t get caught up in the euphoria”
In the midst of all the optimism we see towards key stock indices these days, there are two leading indicators that are flashing warning signals. They say, “Be careful, and don’t get caught up in the euphoria.” Read More »
12. Beginnings of Massive Stock Market Correction Developing: Don’t Delay, Prepare Today!
No stock can resist gravity forever. What goes up must eventually come down. This is especially true for stock prices that become grotesquely distorted. We have been – and still are – living in another dotcom bubble, and – like the last one – it is inevitable that it is going to burst. Read More »
 munKNEE.com Your Key to Making Money


Since fewer Globally are in a financial position to invest, it makes sense to me that as wealth becomes concentrated in fewer investors, traditional stocks will not continue to increase in value because those owning the majority of these stocks are the same entities that are in a position to be selling them, so I expect to see market stagnation as compared to in the past when a far greater number of people were active in the market.