Is there a one-to-one positive correlation between the price of gold and the U.S. public debt? [Yes and no. Let me explain.]
The above comments, and those below, have been edited by Lorimer Wilson, editor of munKNEE.com (Your Key to Making Money!) and the FREE Market Intelligence Report newsletter (see sample here – register here) for the sake of clarity ([ ]) and brevity (…) to provide a fast and easy read. The contents of this post have been excerpted from an article* by Arkadiusz Sieron/Przemyslaw Radomski (sunshineprofits.com) originally entitled Does Public Debt Drive The Gold Price? and which can be read in its unabridged format HERE. (This paragraph must be included in any article re-posting to avoid copyright infringement.)
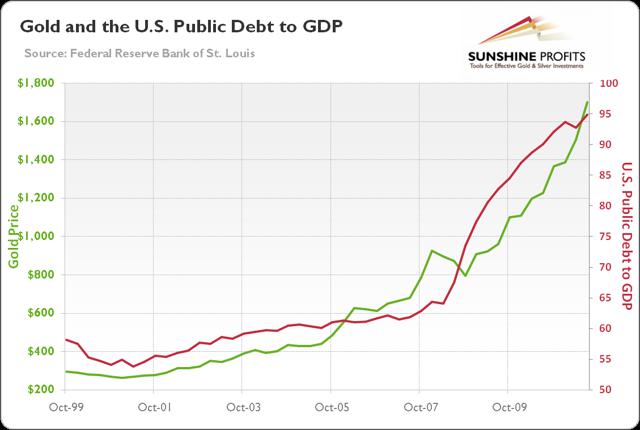
There is a grain of truth in the theory that public debt is a driver of the price of gold. As can be seen in the chart below, in the 2000s bull market, gold went hand in hand with the U.S. debt.
Chart 1: Gold price (green line, left scale, PM fixing) and U.S. public debt to GDP (red line, right scale, in %) from 1999 to 2001
There is, however, one problem with this chart. We have cherry-picked the time horizon, to stress the importance of using a proper perspective when looking at charts, especially these provided by perma-bulls (those saying that gold can only go up) wanting to confirm their bias. How does the whole picture look?
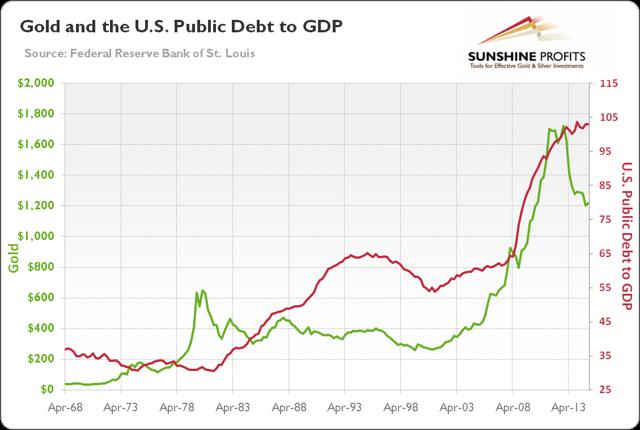
Chart 2: Gold price (green line, left scale, PM fixing) and the U.S. public debt to GDP (red line, right scale, in %) from 1968 to 2015
As the long-term chart above shows, there is no one-to-one positive correlation between the price of gold and the U.S. public debt.
- The price of gold was rising from 1971 to 1980, while the relation of U.S. public debt to GDP was declining,
- the ratio increased significantly during the 20-year bear market in gold….[and] the positive correlation broke in 2013, when the price of gold plunged, despite rising indebtedness.
Although there was a period where the price of gold and public debt moved in tandem, there were longer periods where they did not. Changing the charts’ time frame and cherry-picking historical data to fit the narrative are perhaps the most common manipulation practices among gold analysts, so it is important to always analyze the bigger picture.
*http://seekingalpha.com/article/3524036-does-public-debt-drive-the-gold-price?ifp=0
Read http://deviantinvestor.com/7357/gold-the-end-and-the-beginning/ for a different perspective.
Related Articles from the munKNEE Vault:
1. Growth In National Debt Is 86% Correlated to the Price of Gold! Got Gold?
The correlation between the gold price, silver price and the debt growth has been amazingly accurate since 2001. Government spends too much money to perform a few essential services and to buy votes, wars, and welfare, and thereby increases its debt almost every year, while gold and silver prices, on average, match the increases in accumulated national debt.
2. Continued Growth In U.S. Public Debt Suggests $2,000 Gold – Here’s Why
The price of gold, on a quarterly basis, is 86% correlated – yes, 86%! – to total government debt going back to 1975… and a shocking 98% over the past 15 years!. Despite the current rumblings, everyone is aware that the debt ceiling will be raised and will likely surpass $20 trillion by the end of President Obama’s term. That would put the price of gold at about $2,000 per ounce.
3. Noonan: The Fed Will Never Ever Taper & What That Means For Gold
The Ponzi bubble is bigger than most can imagine. Western central planners… [continue to try to] suppress gold and silver in order to keep their sorry lives alive. In the process, the destruction of people’s financial well- being is unabated
 munKNEE.com Your Key to Making Money

