I receive a lot of questions about market capitalization, or “market cap” and…this article breaks the concept of market capitalization down and shows some of the unintuitive nuances of how it works.
Stock Market Capitalization Definition
The market capitalization of a company represents the total price of the whole company. It is calculated as the number of shares in existence multiplied by the price of the shares. For example, if a company consists of 500 million shares, and each share is currently worth $50, then the company has a $25 billion market capitalization.
In reality, if a larger company were to try to buy out the full company, they would have to pay a premium for the company to ensure that the board of directors and the majority of shareholders of that company agree with the acquisition. For example, they might have to pay $30 billion in order to buy a $25 billion market cap company, so that the board of directors agrees to it and signs off on all of the shares being transferred (even those shares of individual investors that might not have wanted to sell, since the legal entity itself gets absorbed into the buyer).
Aside from acquisitions, the market capitalization of an asset is the number of pieces that it exists as, multiplied by the price of those pieces…
Market Capitalization vs GDP
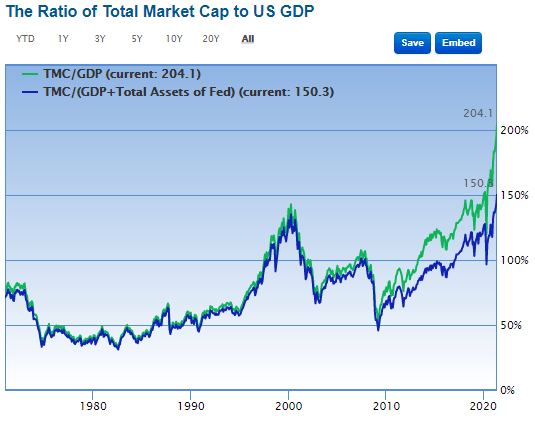
Aside from the CAPE ratio, the Q ratio, and all sorts of broad valuation methods, some investors like to watch market capitalization as a percentage of GDP. It gives a “sanity check” on how large the market is relative to the size of the economy.
Guru Focus, for example, has a long-term chart that shows the ratio of U.S. stock market capitalization to U.S. GDP in green. As of this writing, this is at a record high of over 200%. They also have a modified version that adds the Federal Reserve’s balance sheet to GDP, in blue:

Chart Source: Guru Focus
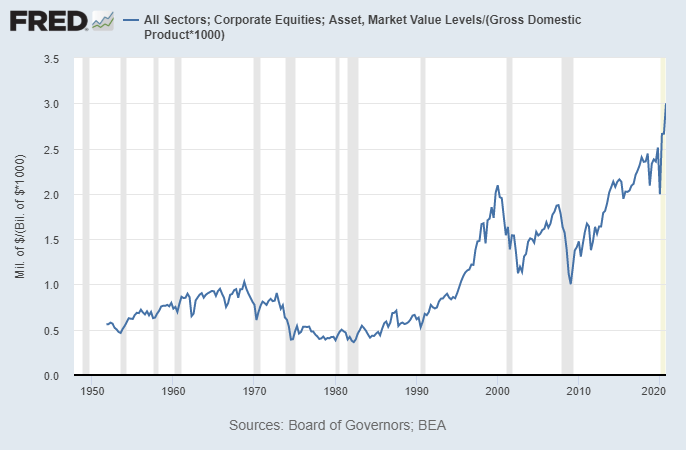
If we look at the value of all U.S. public and private equity value on this next chart, the sum is equal to around 300% of U.S. GDP, compared to about 200% in 2000.

Chart Source: St. Louis Fed
…The biggest threat to U.S. equity market capitalization at these atypically high levels would be a reversal of some or all of these trends.
- If labor segments gain more leverage over capital markets, and/or
- if corporate tax rates start going up, and/or
- if interest rates go up somewhat, and/or
- if this feedback loop of foreigners reinvesting US trade deficits back into the US stock market reverses,
then US market capitalization at this level compared to GDP would likely be hard to sustain.
Editor’s Note: The original article by Lyn Alden Schwartzer has been edited ([ ]) and abridged (…) above for the sake of clarity and brevity to ensure a fast and easy read. The author’s views and conclusions are unaltered and no personal comments have been included to maintain the integrity of the original article. Furthermore, the views, conclusions and any recommendations offered in this article are not to be construed as an endorsement of such by the editor. Also note that this complete paragraph must be included in any re-posting to avoid copyright infringement.
A Few Last Words:
- Click the “Like” button at the top of the page if you found this article a worthwhile read as this will help us build a bigger audience.
- Comment below if you want to share your opinion or perspective with other readers and possibly exchange views with them.
- Register to receive our free Market Intelligence Report newsletter (sample here) in the top right hand corner of this page.
- Join us on Facebook to be automatically advised of the latest articles posted and to comment on any of them.
 munKNEE.com Your Key to Making Money
