The Federal Reserve is pursuing monetary policies that are explicitly designed to inflate asset prices. The rationalization is that ballooning asset prices will create the “wealth effect”…[and this article looks at] the per-capita progress of that wealth effect – what it means and what it accomplishes.
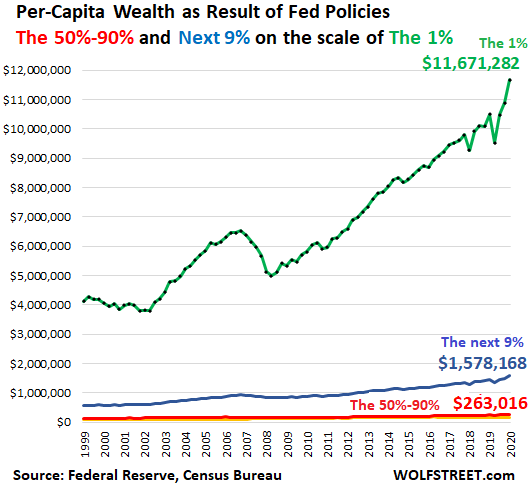
At the end of 2020, the per-capita wealth (assets minus debts) was:
- The 1% = $11.7 million per person (green);
- The next 9% = $1.6 million per person (blue);
- The 50% to 90% = $263,016 per person (red line at the bottom).
- The bottom 50% = $15,027 per person. That amount of wealth is so small it doesn’t show up on this per-capita chart that is on a scale of wealth that accommodates the 1%.
The total population in 2020, according to the Census Bureau, was 330 million people.
- The 1% amount to 3.3 million people. Back in 2000, the population was 283 million people, and the 1% amounted to 2.8 million people, so the 1% has grown by 473,000 people because the population has gotten larger.
- The 50% – the have-nots, as we’ll see in a moment – have grown by 24 million people.
- Among the bottom 50%, there are still large differences: The group ranges from the homeless and the desperately poor, to those at the upper levels of the bottom 50% that have a small-ish 401k and some equity in a house. The chart below shows the wealth of the bottom 50% (purple line) on the scale of the 50%-90% (red line).
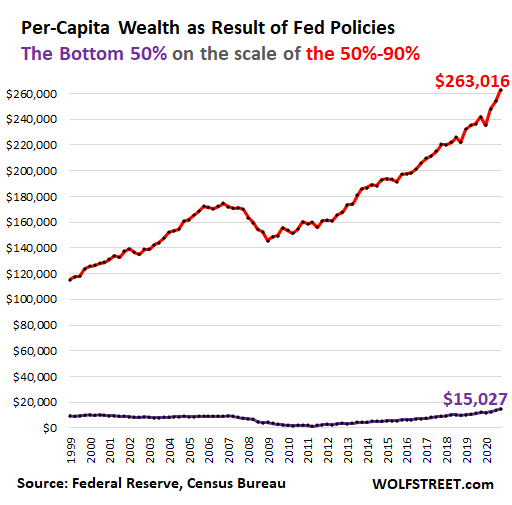
That wealth of the bottom 50% is composed of $45,866 in assets minus $30,383 in debts per capita so, at the end of 2020, the per-capita wealth of the bottom 50% was $15,027.
Note that this “wealth” of the bottom 50% has grown by only $5,000 in 20 years, as all other wealth levels, even the 50%-90%, have pulled away, thanks to the Fed’s policies of asset price inflation.
This “wealth,” if you can call it that, is not adjusted for inflation. In real terms, adjusted for inflation over the past 20 years, it looks a lot worse for the bottom 50%.
1. Real estate is the largest category at $23,457 per person (black line in the chart below).
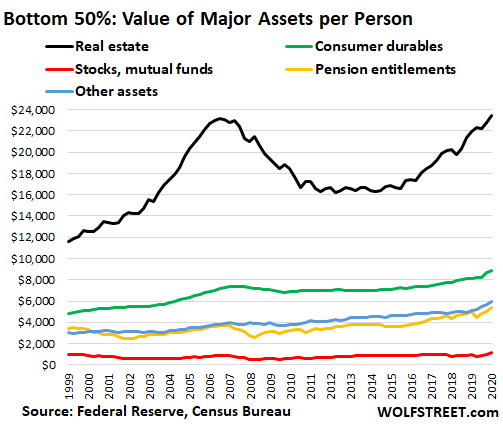
What this means is that relatively few households in the bottom 50% own real estate so, when the Fed inflates the housing market, most people in the bottom 50% don’t benefit because they don’t own a home but they have to pay more to rent, and they get further locked out from buying a home.
2. Durable goods is the second largest category of the bottom 50% at $8,899 per person, such as appliances, cars, and cellphones (green line). That amount ticked up over the last three quarters as folks used their stimmies from the government (not the Fed) to buy some durable goods.
3. Stocks and mutual funds, the smallest category of the assets, account for only $1,131 per person (red line), so when the Fed inflates the stock market, the bottom 50% don’t benefit at all. That’s reserved for the top 10%.
The bottom 50%, however, do have a lot of debt, relatively speaking, particularly consumer debt – auto loans, student loans, and revolving debt such as credit cards. In 2018, on a per-capita level, the amount in consumer debt and other debt surpassed mortgage debt and reached $15,990 per person at the end of 2020:

The wealth effect was designed for the top 10%. At the bottom 50%, their financial well-being got intentionally gutted by the higher costs of living that the Fed’s asset price inflation has caused…
Over the 12 months from the end of 2019 through the end of 2020, the wealth of:
- the top 10% increased by $409,000 per person, thanks to the Fed…[while]
- the bottom 50% increased by $3,152 per person, largely due the crumbs handed out by the government (not the Fed), including the stimmies
and the wealth disparity between:
- the top 10% and the bottom 50% soared by over $400,000 per person to a new historic high…[while] the wealth disparity between
- the 1% and the bottom 50% ballooned by $1.1 million per person.
…Politicians in Washington of all stripes – who could stop the Fed’s policies with legislation – are fully on board with the wealth effect because they’re among the primary beneficiaries – and to heck with the bottom 50%…
Editor’s Note: The original article by Wolf Richter has been edited ([ ]) and abridged (…) above for the sake of clarity and brevity to ensure a fast and easy read. The author’s views and conclusions are unaltered and no personal comments have been included to maintain the integrity of the original article. Furthermore, the views, conclusions and any recommendations offered in this article are not to be construed as an endorsement of such by the editor. Also note that this complete paragraph must be included in any re-posting to avoid copyright infringement.
A Few Last Words:
- Click the “Like” button at the top of the page if you found this article a worthwhile read as this will help us build a bigger audience.
- Comment below if you want to share your opinion or perspective with other readers and possibly exchange views with them.
- Register to receive our free Market Intelligence Report newsletter (sample here) in the top right hand corner of this page.
- Join us on Facebook to be automatically advised of the latest articles posted and to comment on any of them.
