The Gold/Copper price ratio is a way to examine the state of the economy through the relative performance of the “pro-growth” copper price and the “anti-growth” gold price. This filters out the distorting effect of currency inflation/deflation, and allows us to focus only on gold and copper themselves. In 2016 we have a historically high Gold/Copper ratio, the likes of which we have only seen before in the Great Depression, the “stagflation” of the 1970s, and the 2008 Great Recession. This is a clear sign of a slowing, weakening global economy. Below are the details.
The comments above and below are excerpts from an article by Geoffrey Caveney (drstrangemarket.squarespace.com) which has been edited ([ ]) and abridged (…) to provide a faster and easier read.
The copper price is well known as “Dr. Copper”, serving as a leading indicator of the direction of the global economy. Copper is a core industrial input: A rising price signals increasing demand and growing industrial activity, while a falling price indicates declining demand and slowing industrial activity.
The gold price tends to point in the opposite direction. As a safe haven investment, the gold price rises when there is growing fear about the state of the global economy.
Of course, inflation and deflation as we see it in terms of paper currency, has an effect on both the copper and the gold price in US dollar terms. Inflation drives up both prices together. Still, the state of the economy affects copper and gold differently in this case too. In an inflationary economic boom, the copper price will rise more than the gold price. In a “stagflation” scenario, gold will outperform copper.
The Gold/Copper price ratio is a way to examine the state of the economy through the relative performance of the “pro-growth” copper price and the “anti-growth” gold price. This filters out the distorting effect of currency inflation/deflation, and allows us to focus only on gold and copper themselves.
I present the ratio in terms of pounds of copper per ounce of gold, because those are the units of pricing that most investors are familiar with. I use the Gold/Copper ratio rather than the Copper/Gold ratio because whole numbers are easier to interpret and understand than small decimals.
A high number indicates that an ounce of gold can purchase a larger amount of copper, so the gold price is stronger and the copper price is weaker. High number = weaker, slowing economy.
A low number indicates that an ounce of gold can only purchase a smaller amount of copper, so the gold price is weaker and the copper price is stronger. Low number = stronger, growing economy.
Gold/Copper Ratio Tells Economic History Of 19th, 20th, & 21st Centuries
It is surprising how clearly the course of the Gold/Copper ratio, over the decades from the 1850s to the present, describes the economic history of the 19th, 20th, and 21st centuries.
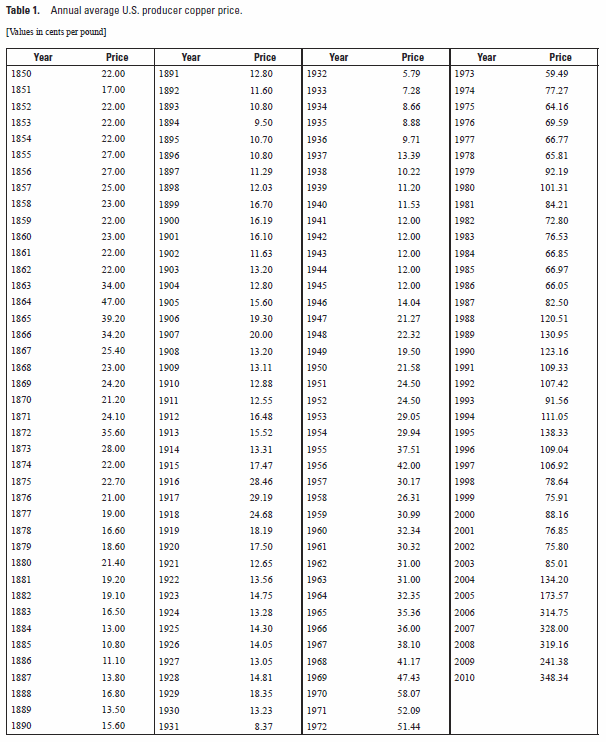
I calculated the annual averages of the Gold/Copper ratio for the years 1850-1989 from tables of the annual average prices of copper and gold:

Table courtesy of the USGS’s Metal Prices in the United States Through 2010, p. 50. The table of annual average gold prices from 1833 to 2011 can be found at this page on the website of the National Mining Association.
The 19th century and early 20th century data can best be summarized by the average Gold/Copper ratio for each decade: [Remember: Low number = stronger, growing economy; High number = weaker, slowing economy.]
- 1850s: 84 lbs Cu/oz Gold
- 1860s: 69 lbs Cu/oz Gold
- 1870s: 86 lbs Cu/oz Gold
- 1880s: 128 lbs Cu/oz Gold
- 1890s: 160 lbs Cu/oz Gold
- 1900s: 129 lbs Cu/oz Gold
- 1910s: 111 lbs Cu/oz Gold
- 1920s: 144 lbs Cu/oz Gold
For this entire 80-year period, the Gold/Copper ratio remained relatively stable between 70-160 lbs Cu/oz Gold, fluctuating with various business cycles and economic periods, but not in an extreme way. Overall, the Gold/Copper ratio in this range indicates a growing economy.
Then came the Crash of 1929 and the Great Depression. The skyrocketing Gold/Copper ratio tells the story: [Remember: Low number = stronger, growing economy; High number = weaker, slowing economy.]
- 1929: 112 lbs Cu/oz Gold
- 1930: 156 lbs Cu/oz Gold
- 1931: 204 lbs Cu/oz Gold
- 1932: 357 lbs Cu/oz Gold
- 1933: 362 lbs Cu/oz Gold
- 1934: 401 lbs Cu/oz Gold
The ratio stayed high throughout the 1930s, and during World War II the U.S. government implemented price controls on copper, so the ratio stayed at 282 lbs Cu/oz Gold.
As the U.S. economy boomed after the war, the Gold/Copper ratio fell dramatically:
- 1950s: 122 lbs Cu/oz Gold
- 1960s: 103 lbs Cu/oz Gold
…returning to its normal range from before the Great Depression.
The recession of 1973-74 and the ensuing “stagflation” of the 1970s into 1980 sent the gold price soaring far higher than copper, and the Gold/Copper ratio rose to its Depression-era levels: [Remember: Low number = stronger, growing economy; High number = weaker, slowing economy.]
- 1970: 62 lbs Cu/oz Gold
- 1971: 78 lbs Cu/oz Gold
- 1972: 114 lbs Cu/oz Gold
- 1973: 164 lbs Cu/oz Gold
- 1974: 199 lbs Cu/oz Gold
- 1975: 251 lbs Cu/oz Gold
- 1976: 179 lbs Cu/oz Gold
- 1977: 221 lbs Cu/oz Gold
- 1978: 294 lbs Cu/oz Gold
- 1979: 332 lbs Cu/oz Gold
- 1980: 607 lbs Cu/oz Gold
Note how this ratio indicates economic weakness and crisis in both the 1930s and the 1970s, filtering out the noise of deflation in the ’30s and inflation in the ’70s. In both cases, the underlying economy was weak.
The Gold/Copper ratio settled down after 1980, but it stayed high compared to the early 20th century and 1950s-60s levels. The average for the entire decade of the 1980s was 499 lbs Cu/oz Gold! [Remember: Low number = stronger, growing economy; High number = weaker, slowing economy.]
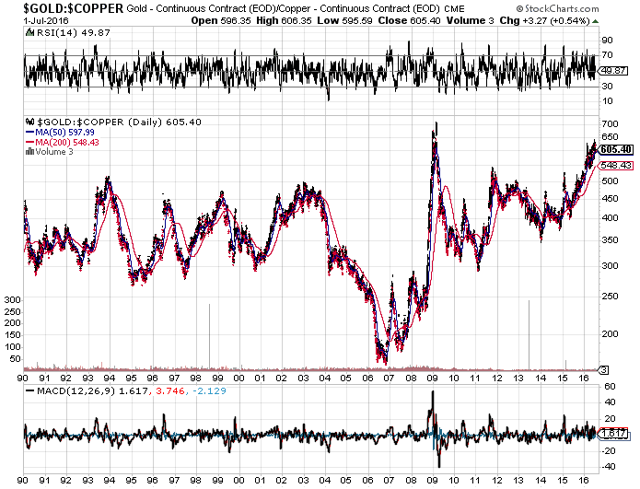
Beginning in 1990 we can use a modern price chart to look at the course of the Gold/Copper ratio and see that the ratio settled into a new range of 300-550 lbs Cu/oz Gold.

The commodity boom in 2005-2006 sent the copper price soaring and brought the ratio down as far as nearly 150 lbs Cu/oz Gold, but then the ratio began to rise, and the market crash of 2008 sent the ratio all the way to 700 lbs Cu/oz Gold, similar to the 1980 peak…
In the recovery that began in 2009, the Gold/Copper ratio returned to its previous range of 300-550 lbs Cu/oz Gold but in 2016, the Gold/Copper ratio is now breaking out above the old range again. [Remember: Low number = stronger, growing economy; High number = weaker, slowing economy.]
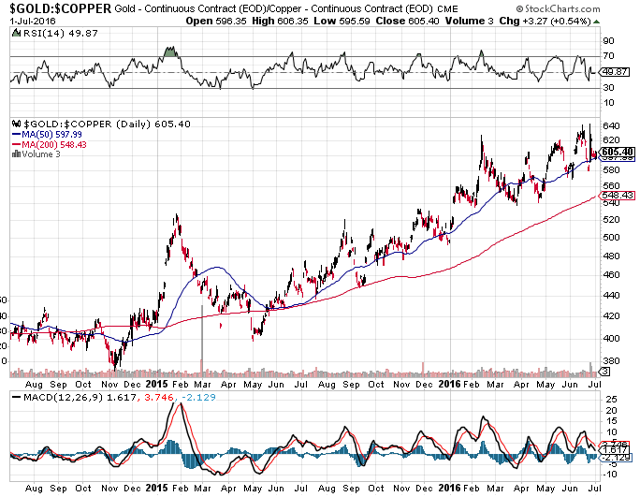
- The ratio almost touched 650 lbs Cu/oz Gold after the Brexit vote, and
- it remains elevated and on a rising uptrend at 605 lbs Cu/oz Gold as of July 1.
The following chart clearly shows the rising trend since November 2014:

Conclusion:
In 2016 we now have a historically high Gold/Copper ratio, the likes of which we have only seen before in the Great Depression, the “stagflation” of the 1970s, and the 2008 Great Recession. This is a clear sign of a slowing, weakening global economy.
This analysis indicates that the commodity price rebound since February is a false signal, since commodity prices are getting far outpaced by the rising gold price. In terms of true value, priced in gold, commodities are still falling in value, not rising.
The indicated action to take right now is to invest in gold… not copper… or other commodities. With this indicator pointing to a slowing global economy, the outlook for the broader stock market…appears poor.
Disclosure: The above article has been edited ([ ]) and abridged (…) by the editorial team at  munKNEE.com (Your Key to Making Money!)
  to provide a fast and easy read.
 munKNEE.com Your Key to Making Money