Simply because the P/E for a sector or individual stocks is high does not necessarily mean the sector or stock is overvalued. Importantly, the P/E should be compared to the earnings growth rate for each sector or company. By dividing the P/E by the earnings growth rate, one obtains the PEG ratio (PE to growth rate.) [This article compares each sector’s P/Es to each sector’s PEG ratio and comments on which sectors are over and under valued.]
The comments above and below are excerpts from an article by David I. Templeton, CFA which has been edited ([ ]) and abridged (…) to provide a faster and easier read.
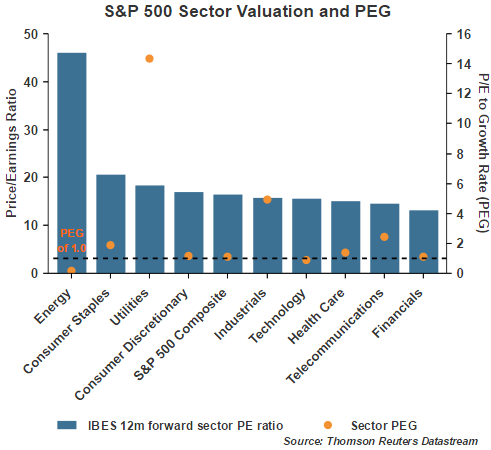
…When evaluating the PEG, a PEG of 1.0 is an indication a sector or company is fairly valued. If the PEG is less than 1.0, this is an indication the sector or company may be undervalued. Conversely, PEGs greater than 1.0 are indications of overvaluation relative to fair value.
As can be seen in the above chart, the energy sector is trading at a P/E of greater than 40, but what is the PEG? Below is a chart comparing the sector P/Es to each sector’s PEG ratio. The growth rate used in the denominator is Thomson Reuters’ I/B/E/S earnings growth rate for Q2 2017, or one year forward.
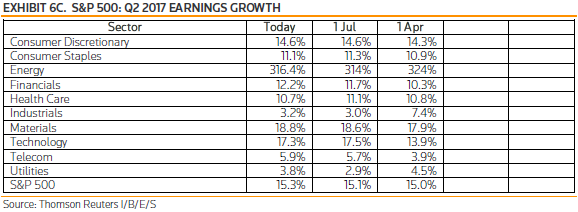
Below is the table detailing the earnings growth rates for each sector as reported in Thomson Reuters’ 7/8/2016 This Week In Earnings report.
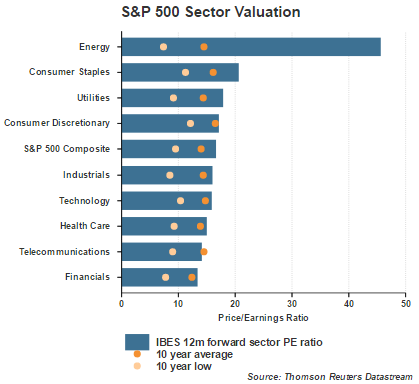
Clearly, the PEG for the utility sector shows investors that are buying utility stocks are paying up for the single digit earnings growth…One reason this has occurred is investors are purchasing dividend yielding investments in part because they are unable to get that yield in bonds. This reach for yield appears to have pushed some of these yielding sectors and stocks to elevated valuation levels. The first chart in this article does show the forward P/E for utilities is higher than the 10-year average P/E for the sector as well.
The other factor to note is some stocks/sectors trade at higher PEs. Looking at the telecommunications sector for example, the current forward P/E is lower than the sectors 10-year average P/E. As a result, comparing each individual sector’s P/E and earnings growth rate with its respective historical data is also important.
Conclusion
P/E and earnings growth rates are only a couple of factors investors should use in evaluating equity investment opportunities…[but] the PEG ratio can be useful as a starting point. In the end, just because a company appears to be great, does not mean it is a great investment at all points in time.
Recently, investors have pursued income yielding investments for their safety characteristics…[but] many of these income investments are priced…’for perfection’. In other words, the slightest bit of negative news for some of these yield plays could result in strong price declines.
Disclosure: The above article has been edited ([ ]) and abridged (…) by the editorial team at  munKNEE.com (Your Key to Making Money!) to provide a fast and easy read.
“Follow the munKNEE” on Facebook, on Twitter or via our FREE bi-weekly Market Intelligence Report newsletter (see sample here , sign up in top right hand corner)

Links to More Sites With Great Financial Commentary & Analyses:
ChartRamblings; WolfStreet; MishTalk; SgtReport; FinancialArticleSummariesToday; FollowTheMunKNEE; ZeroHedge; Alt-Market; BulletsBeansAndBullion; LawrieOnGold; PermaBearDoomster; ZenTrader; EconMatters; CreditWriteDowns;