An analysis of the ratio between the market capitalization of gold (MCG) and the  gross world product (GWP) over the past 63 years suggests that the current price for gold has further to fall and that it would not be wise to begin buying gold until prices have fallen below at least $1100 or $950.
So writes Michael Long in edited excerpts from his article* as posted on SeekingAlpha.com entitled Gold/GWP: Why Gold May Still Have Further To Fall.
[The following article is presented by Lorimer Wilson, editor of www.munKNEE.com and the FREE Market Intelligence Report newsletter (sample here) and may have been edited ([ ]), abridged (…) and/or reformatted (some sub-titles and bold/italics emphases) for the sake of clarity and brevity to ensure a fast and easy read. This paragraph must be included in any article re-posting to avoid copyright infringement.]
The MCG to GWP Ratio Calculation
I calculated the MCG for each year from 1950 to 2012 by subtracting annual gold production from a starting point of 165,000 tons at the end of 2011 and multiplying the resulting figure in ounces by the 2010 adjusted year-end price gold for each year. I then divided the MCG for each year by the base 2010 GWP of each year.
click to enlarge images
MCG/GWP Ratio Average Over Time
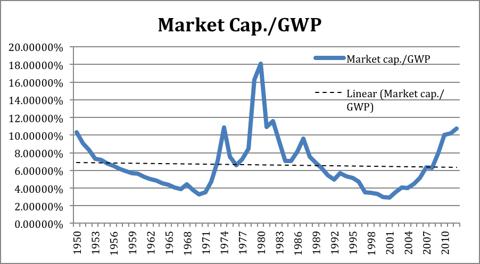
Over the entire 63-year period displayed above, the average MCG/GWP ratio was 6.61%. The average ratio remains fairly stable when it is measured over different time periods. For example, the average ratio since 1970 was 6.9% and the average ratio since 1990 was 5.48%.
MCG/GWP Ratio Implications
- If the MCG/GWP ratio is mean reverting then there are a number of interesting implications. For one, this would mean that investors could earn a positive long-run real return by investing in gold.
- If gold were merely a long-term inflation hedge, as some have suggested, then one would expect to see a clear downward trend in the ratio, as gold became a smaller and smaller part of a growing world economy.
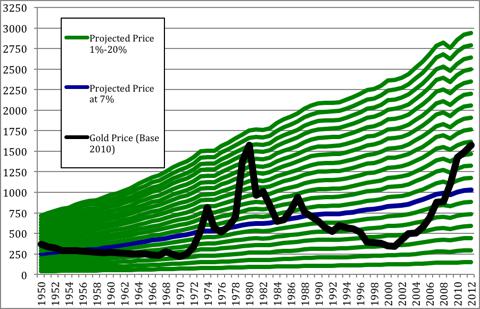
- Another implication is that the ratio can be used as a useful tool in pricing gold. Below I have plotted the gold prices that would have occurred at a number of market capitalization ratios against actual gold prices in 2010 dollars.
In terms of inflation-adjusted gold prices, it is well known that gold prices reached extreme highs in 1980 and 2011. However, interestingly, the MCG/GWP ratio at the end of 1980 was much more of an extreme than the ratio at the end of 2011.
- At the end of 1980, the MCG was over 18% of the world’s annual economic output.
- While still well above average, the MCG at the end of 2011 was between 10 and 11%.
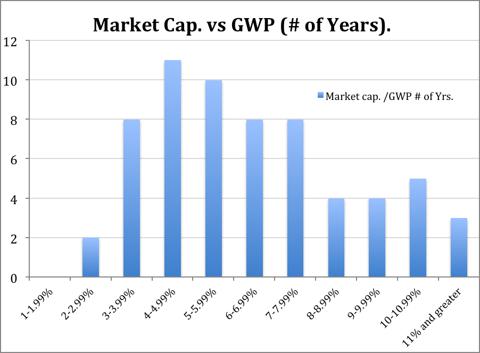
The chart above suggests that extreme gains in gold, such as prices over $2000, are unlikely to occur and unlikely to last. A gold price above $2000 (in 2010 dollars) would require a MCG/GWP ratio of over 14%. This has only occurred twice at year-end over the last 63 years. If gold prices were to reach such levels in the near term, it would likely be the product of inflation and would not result in real gains.
Below I have displayed the distribution of MCG/GWP ratios over the last 63 years.
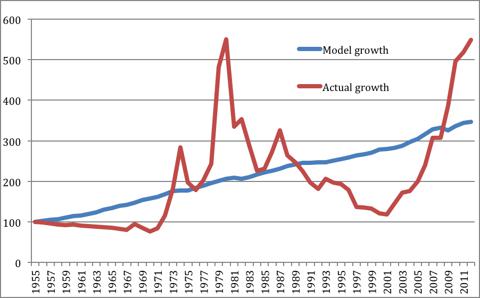
Another implication of the foregoing is that a simple model for long-run real gold price growth can be derived: [X%GWP] * [(1+G)/(1+S)], where X%GWP is a percentage of the world’s economic output, 1+G is the rate of growth of GWP, and 1+S is the rate of growth in the supply of gold.
As long as GWP continues to grow faster than the supply of gold, then an investor should expect to see a positive long-run inflation-adjusted return to owning gold. Over the last 63 years the growth rate in the supply of gold has been surprisingly consistent, ranging from a low of about 1.25% to a high of 1.95% and averaging 1.63%.
Below I have compared model gold price growth to actual gold price growth since 1955 using a base of 100. Note that in 1955 the MCG/GWP ratio was 6.76%.
Long-run Inflation-adjusted Return To Owning Gold
- From a year-end 2012 standpoint, assuming a MCG/GWP ratio of 6%-7%, gold should be priced between $880 and $1026 in 2010 dollars.
- Adjusting for 3 years of inflation, gold should be priced between approximately $940 and $1096.
Conclusion
The above suggests that current gold prices still have further to fall and that it would not be wise to begin buying gold until prices have fallen below at least $1100 or $950.
[Editor’s Note: The author’s views and conclusions in the above article are unaltered and no personal comments have been included to maintain the integrity of the original post. Furthermore, the views, conclusions and any recommendations offered in this article are not to be construed as an endorsement of such by the editor.]
Source: http://seekingalpha.com/article/1547422-gold-gwp-why-gold-may-still-have-further-to-fall (© 2013 Seeking Alpha)
Related Articles:
1. These 4 Indicators Say ” the immediate outlook doesn’t look good for gold”
Below are the four most important factors that influence the price of gold indicators….If you understand and correctly interpret these four indicators, I guarantee you’ll make more intelligent buy/sell decisions. More importantly, you’ll make more profitable ones as well. Read More »
2. Noonan: Charts Suggest Potential Support for Gold Down at $1,040 to $1,100
If you want to make rabbit stew, first, you have to catch the rabbit so hopefully, first, we’ll see some concrete signs that a bottom is in before the regurgitation of “Gold is going to $10,000!” starts showing up in a host of new articles pandering for attention. The best way is to decide for yourself…so let us go to the most reliable source, the market, and see what the prices of gold and silver have to say about what everyone else has been saying about them. People have been known to exaggerate, even lie in their “opinions,” but the market never does either. Read More »
An earlier article on gold & silver went viral with almost 30,000 reads on munKNEE.com alone and continues to be read by hundreds of goldbugs daily. Below is an updated chart and analysis suggesting that gold & silver have further to drop before they go parabolic. Take a look and share it with friends. Read More »
4. Gold to Plummet to $1,200 – $1,250 & Ultimately Drop to $1,000 – $1,100
So claims Greg Guenthner (http://dailyreckoning.com). He stated that once gold breached $1,350 it would plummet to $1,200 – $1.250. So far, so good, but will his $1,000 – $1,100 price for gold come true?
5. Nouriel Roubini: Gold to Be Gutted! Here’s Why
Roubini expects gold will fall below $1,000/oz, taking prices down to approximately 30% from current levels; a point not seen since 2007. Here’s why. Read More »
6. Gold Bugs: Look Out Below! Gold Could Drop to $1,000
Scott Grannis (http://scottgrannis.blogspot.ca) thinks gold could fall to $1000, or even less, as it realigns with other commodity prices.
7. Given the Selloff, Is Now a Good Time to Buy Gold?
My answer is no. In fact, depending on their overall allocation, I believe investors should consider trimming their holdings. Here are 4 reasons why that is the case. Read More »
 munKNEE.com Your Key to Making Money


What do you think about current gold price?
I think the price of gold will rise within the next few months
This was a great post on how to get the most cash for gold. With the recent drop we predict many more people will start selling their gold than before.
I Don’t believe so, there are more buyers then sellers now, but once it rises the selling would start, and then who knows the direction but i think up, what do you think?