Gold bugs: look out below! There are undoubtedly a lot of speculative purchases that may need to be unwound in coming years. I think gold could fall to $1000 or even less as it realigns with other commodity prices.
So writes Scott Grannis (http://scottgrannis.blogspot.ca) in edited excerpts from his original article* entitled The End Of The Second Great Gold Rally.
This post is presented compliments of Lorimer Wilson, editor of www.munKNEE.com (Your Key to Making Money!) and the Intelligence Report newsletter (It’s free – sign up here). You can also “Follow the munKNEE” daily posts on Twitter or Facebook. The article may have been edited ([ ]), abridged (…) and/or reformatted (some sub-titles and bold/italics emphases) for the sake of clarity and brevity to ensure a fast and easy read. Please note that these paragraphs must be included in any article re-posting to avoid copyright infringement.
The…bull market in gold has come to an end…This could be a wild ride.
(click to enlarge)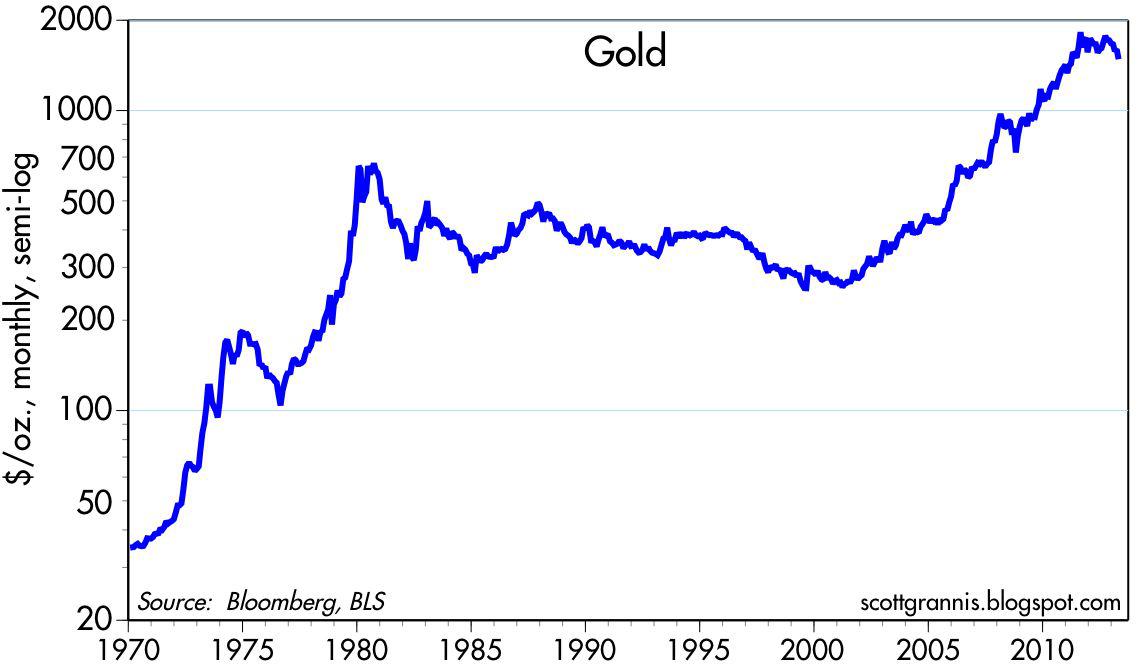
The First Great Gold Rally
The first great gold rally occurred in the 1970s, sparked by Nixon’s decision to abandon the dollar’s link to gold. The Fed had been failing to tighten policy since the mid-1960s, despite continual outflows of gold which were symptomatic of declining dollar demand and rising dollar supply – in short, dollars were in excess supply. Set free, gold rose from $35/oz. to a peak of $850 in January 1980, for a spectacular gain of over 2,330%, and the excess of dollars combined with loss of confidence in the dollar fueled a surge of inflation. That incredible gold rally was brought to an end by Fed chairman Paul Volcker, who in 1979 decided to slam on the monetary brakes in order to bring inflation under control. From its peak in early 1980, gold proceeded to fall for the next 21 years.
(click to enlarge)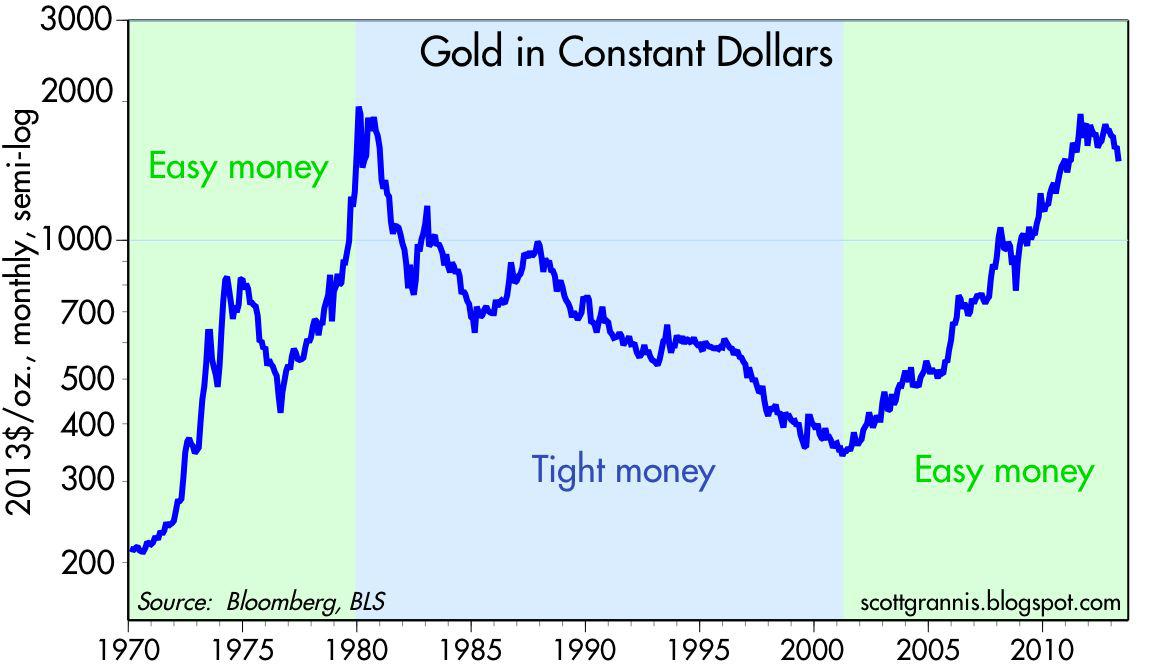
The chart above converts the nominal price of gold, shown in the first chart, into an inflation-adjusted or constant dollar price. This also highlights how significant the big moves in gold were, and how well they corresponded to sea-changes in monetary policy. The big decline in gold from 1980 through 2000 coincided with generally tight monetary policy that brought inflation down from double digits to only 2%.
The Second Great Gold Rally
The second great gold rally began in 2001, around the time the Fed realized that it had been too tight for too long and began reducing the Fed funds rate target from 6.5% to 1.75% over the course of that year. The PCE deflator fell at a -0.4% annual pace in the second half of 2001, which was the first time it had ever visited deflationary levels – proof that the Fed had been too tight. As the Fed embraced easy money, gold rose from a low of $256 in early April 2001 to a high of $1900 in September 2011, for a gain of 642%. In real terms, gold reached almost the same levels it had in early 1980.
The latest gold rally is now over… Many will speculate about its origins and its recent demise, but for me it is fairly straightforward. Gold rose because:
- it had been suppressed by 21 years of tight monetary policy which ended in 2002 and because
- the market began to sense that the Fed was too easy – that lowering the funds rate target to 1% and keeping it there from mid-2003 to mid-2004 was excessive ease – and that it was an inflationary mistake – and indeed it was:
- housing prices soared from 2002 through 2006;
- commodity prices soared from late 2001 through 2008; and
- the CPI registered a 5.5% increase in the 12 months ended July 2008.
After a brief decline in 2008, when the financial crisis caused a surge in dollar demand that the Fed was slow to respond to, gold resumed its upward climb. Commodities also suffered in 2008, but even more so than gold because a the global recession destroyed demand. Like gold, commodities then resumed their rally from 2009 through early 2011. Commodities peaked in April 2011, and gold peaked shortly thereafter, in August 2011.
(click to enlarge)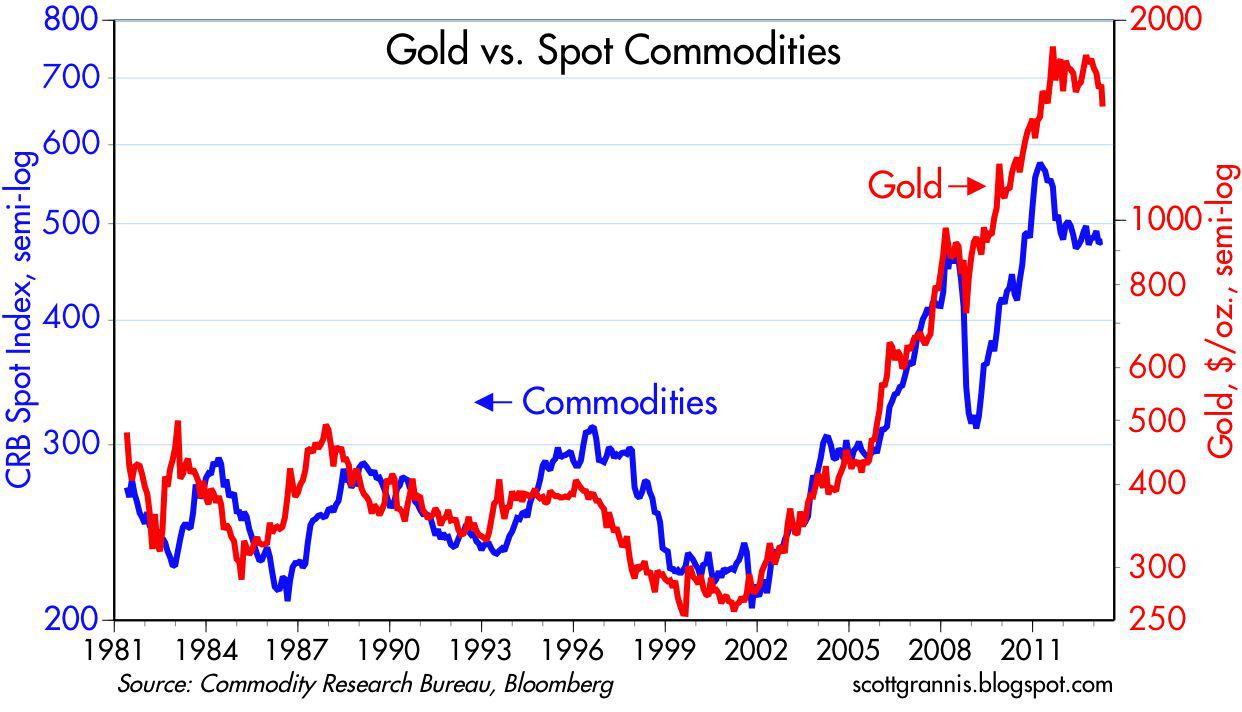
As the chart above suggests, gold overshot commodity prices by a significant amount over the past five years.
- Speculative fever, as expressed by numerous analysts and pundits who called for gold to rise to $15,000, $20,000, and even $46,000, could be one reason. [Read: These 40+ Analysts See Gold Going to $5-6,000 (on average) By Late 2014/Early 2015]
- The Fed’s quantitative easing programs plumbed uncharted depths and caused any number of people, myself included, to worry that the result could be a lot of inflation and perhaps even a collapse of the dollar.
- Most of the world’s major central banks (with the notable exception of the Bank of Japan) became ultra accommodative in the wake of the global financial crisis and recession.
- The Eurozone sovereign debt crisis that erupted in 2010 and 2011 threatened the dissolution of the euro, which by then had become one of the world’s most important currencies.
The End of the Second Great Gold Rally
One after one, [however,] the fears of hyperinflation, a dollar collapse, or a euro collapse fell by the wayside, and now the Fed is…ending QE3 within a matter of months…
(click to enlarge)
Conclusion
Looking ahead, as a first approximation, I think gold could fall to $1000 or even less as it realigns with other commodity prices (see second chart above)...
Editor’s Note: The author’s views and conclusions in the above article are unaltered and no personal comments have been included to maintain the integrity of the original post. Furthermore, the views, conclusions and any recommendations offered in this article are not to be construed as an endorsement of such by the editor.
*http://scottgrannis.blogspot.ca/2013/04/the-end-of-second-great-gold-rally.html
Related Articles:
1. The Future Price of Gold and the 2% Factor

 It is my contention that the price of gold rallies whenever the U.S. dollar’s real short-term interest rate is below 2%, falls whenever the real short rate is above 2%, and holds steady at the equilibrium rate of 2%. Furthermore, for every one percentage point real rates differ from 2%, gold moves by eight times that amount per year. So if the real rates are at 1%, gold will move up at an 8% annualized rate. If real rates are at 0%, then gold will move up at a 16% rate (that’s been about the story for the past decade). Conversely, if the real rate jumps to 3%, then gold will drop at an 8% rate. [Let me explain.] Words: 982
2. What Does the Future Hold for Gold? 3 DeterminantsThe best way to think of gold is as a non-yielding currency with a special trait: The only way to “print” it is to pull it out of the earth at great cost. As a currency with no yield and limited practical use…gold’s investment case largely rests on its ability to insure against currency depreciation. Few people expect to make money by taking out insurance policies. I don’t recommend allocating any more than 10% of a portfolio to gold. Words: 610
3. Startling Relationship Between Gold Price & U.S. Gov’t Debt Suggests What Price for Gold in 2017?
The price of gold, on a quarterly basis, is 86% correlated – yes, 86%! – to total government debt going back to 1975… and a shocking 98% over the past 15 years! [As such,] it would seem like a no-brainer investment thesis to buy gold… as a proxy for the not-otherwise-investable thesis that US total government debt will increase in the future. [But there is more – and it is disappointment for gold bugs – read on!]
4. Gold & Silver in Super Cycles: When Will They Go “Boom” & Then “Bust”?
Commodity prices including those of…[gold and silver] tend to go through super-cycles…[which] last for many years. [Below is a review of the history of such cycles and the length of each. Where are we now in each? When will they go “boom”? When will they go “bust”? Let’s take a look.] Words: 165; Charts: 1; Tables: 3
5. These 40+ Analysts See Gold Going to $5-6,000 (on average) By Late 2014/Early 2015
Analyst after analyst (in excess of 170 at last count) has been forecasting what the parabolic peak price for gold will eventually be. That being said, however, only 43 have been bold enough to include the year in which they think their peak price estimate will occur and they are listed below. Take a look at who is projecting what, by when and why. Words: 400

I hope someone will provide similar charts for Silver…
Hint Hint.