Nearly all markets except the dollar reacted rather badly to Ben Bernanke’s news conference – even though it actually contained no news – Treasury yields soared, stocks were whacked, and so was gold. While the charts certainly don’t look good in the short term, though, it should be pointed out though that investors with a longer time horizon probably won’t make a big mistake by buying on weakness. That being said, however, in the short term all the tentative evidence that a bottoming process may be under way has by now been eradicated. Below are a number of charts illustrating the situation.
So writes Pater Tenebrarum (www.acting-man.com) in edited excerpts from his original article* as posted on SeekingAlpha.com under the title Gold And Gold Stocks, Post FOMC Update. (The charts below are by StockCharts and the table by James Debevec)
[The following article is presented by Lorimer Wilson, editor of www.munKNEE.com and may have been edited ([ ]), abridged (…) and/or reformatted (some sub-titles and bold/italics emphases) for the sake of clarity and brevity to ensure a fast and easy read. This paragraph must be included in any article re-posting to avoid copyright infringement.]
Tenebrarum goes on to say in further edited excerpts:
The Fundamental Backdrop is Still the Same, But …
The FOMC statement was once again almost a carbon copy of the last one. The only noteworthy event worth commenting on is that in addition to the hawkish dissenter Esther George, John Bullard dissented because he felt the Fed’s actions are not dovish enough (he’s worried about ‘inflation being too low’ of all things).
Still, it is the market reaction that counts, and nearly all markets except the dollar reacted rather badly to Ben Bernanke’s news conference – even though it actually contained no news. Treasury yields soared, stocks were whacked, and so was gold.
When we last wrote about gold and gold stocks we remarked that, “Unfortunately…the HUI-gold ratio once again went in the ‘wrong’ direction…[which] is a sign that gold is set to decline further in the short term (we are always open to surprises on that front, but those are rare). Gold itself is conspicuous by its utter failure to profit from recent weakness in the US dollar. This is a bearish sign as well.”
That has indeed turned out to be the case. While neither gold nor the HUI have as of yet broken to new lows, the charts certainly don’t look good in the short term. It should be pointed out though that investors with a longer time horizon probably won’t make a big mistake by buying on weakness. However, in the short term all the tentative evidence that a bottoming process may be under way has by now been eradicated.
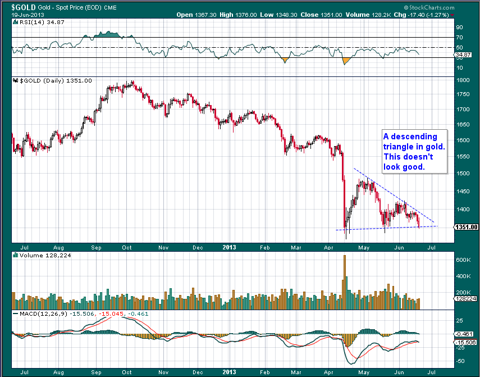
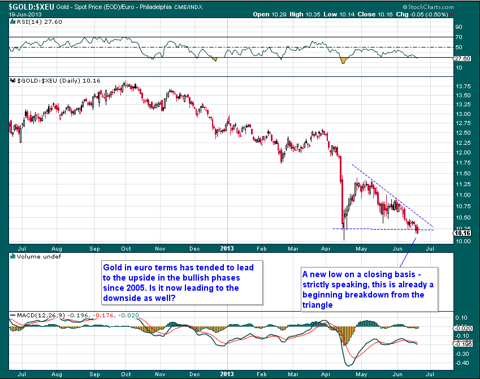
…Gold has now formed a descending triangle, and it is worrisome that gold in euro terms has already fallen to a new closing low, which means that the equivalent triangle in gold/euro is in the process of breaking down (the break is still very small, so it may be reversed, but we’ll only believe that when we actually see it).
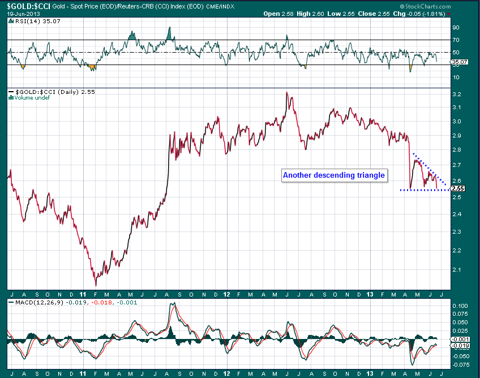
Below are several charts illustrating the situation. Interestingly (oddly in fact), gold has also built a descending triangle relative to the CCI. This is odd because economic activity around the world looks very anemic, and usually gold tends to rise relative to commodities in such an environment.
Gold
A descending triangle on the daily gold chart.
Gold in Euro Terms
Gold in euro terms looks actually slightly worse. It has been a leader to the upside since 2005, is it now a leader to the downside?
The Gold-CCI Ratio
The descending triangle is in evidence here as well
US Dollar Index
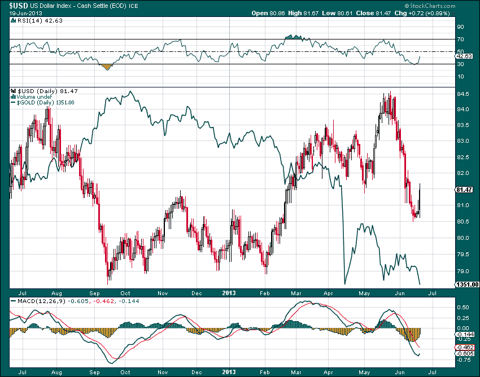
If one looks at a comparison between gold and the dollar index, one can see that gold lately fails to react to dollar weakness, but reacts violently whenever there are signs of dollar strength.
The U.S. dollar versus gold (green line) – gold declines whenever the dollar shows strength, but it fails to rise much when the dollar weakens. This continues to be a negative sign.
Gold Stocks
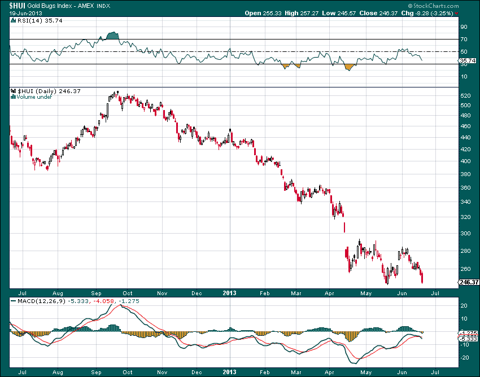
As noted above, the gold stocks have once again been leading to the downside, and have moreover confirmed the recent weakness in gold. The best thing that can be said about the HUI’s daily chart is that a break to new lows would produce yet another momentum divergence (this is to say, a price/RSI, and price/MACD divergence).
…In the context of past instances of gold stocks reaching long-term ‘oversold’ extremes, there has been further short-term weakness in gold stocks in all cases but one when a long-term ‘buy signal’ was given. It may be worth contemplating the table [below] showing the previous occurrences again:
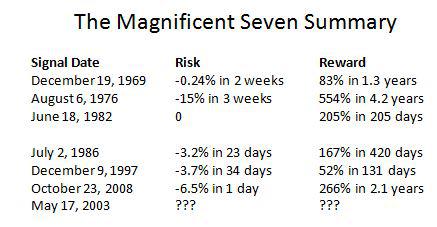
…Long-term oriented investors probably won’t make a mistake if they decide to buy on weakness. There would likely be a few more weeks of soggy action, but interestingly, the bigger the short-term drawdown was in previous cases, the bigger the subsequent rally turned out to be as well.
HUI Index
Since the current correction is reminiscent of the 1970’s mid cycle correction, we may see comparable weakness before a turning point is finally reached. That said, in the short term, the charts certainly don’t look particularly confidence inspiring – as it appears now that the recent back and forth was not a bottoming formation, but rather a continuation formation. There is of course still a chance that a double bottom may be about to form in the HUI, which if it is to happen, must happen more or less immediately:
The HUI is weakening again and the putative bottoming formation is beginning to look like a continuation formation. However, yet another price/RSI divergence is likely to be recorded if new lows should be made.
HUI-Gold Ratio
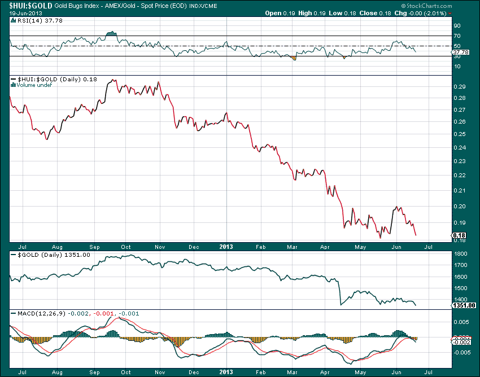
There is also nothing positive to report in terms of the HUI-gold ratio at this point in time – after an attempted breakout to the upside, it has reversed very quickly again and is back at its previous low.
The HUI-gold ratio and gold (green line below) – the ground that has recently been gained has been given up again just as quickly.
Conclusion
None of [the above] charts look positive in the short term.
- A potentially bullish island reversal in the HUI has been negated,
- gold has built a descending triangle, and
- both gold and gold stocks are very close to breaking though near-term support.
In order for the short- term picture to remain at least ‘undecided’, these support levels must hold – a possibility that can of course not be ruled out. It should become evident fairly soon whether that will happen or not.
_____
Save time! Here are 4 ways to access the best articles on the internet!
Sign up for our FREE Market Intelligence Report newsletter (sample)
“Follow the munKNEE” daily posts via Twitter or Facebook
Set up an RSS feed: It’s really easy – here’s how
_____
It continues to be of concern that dollar strength begets weakness in gold, but dollar weakness fails to beget strength in gold. As a result of this, gold looks even weaker in euro terms than in dollar terms – and gold in euro terms has been a leading indicator for the dollar denominated gold for some time.
We continue to believe that the long-term picture has not been altered by this downturn, in spite of how extensive it has turned out to be. Similar declines could be observed on two occasions in the 1960-1980 bull market in gold stocks (in both instances, namely 1969 and 1974-1976, gold stocks as measured by the BGMI plummeted between 60% to 70%). Moreover, gold stocks are at their weakest relative to gold since early 1942.
June is a seasonally weak month for gold. It could therefore be that the current weakness is only transitory, and that things will begin to look better beginning next month. Gold’s behavior in the seasonally stronger period should actually provide us with additional clues.
[Editor’s Note: The author’s views and conclusions in the above article are unaltered and no personal comments have been included to maintain the integrity of the original post. Furthermore, the views, conclusions and any recommendations offered in this article are not to be construed as an endorsement of such by the editor.]
*http://seekingalpha.com/article/1512562-gold-and-gold-stocks-post-fomc-update
Related Articles:
1. Physical Gold Cannot Possibly Lose Out Over Fiat & Digital Currencies – Here’s Why
Gold cannot possibly lose its central position as the pre-eminent money used by the world for thousands of years. The aggressive measures of the Anglo-American Axis with regard to gold are absurd and they will lead to total disaster both for the Axis, and for the world which has been forced to follow its lead for over forty years. Read More »
2. Increasing Evidence Indicates a Reversal in Gold & Silver Trend Is Near
We can find nothing – nothing – that has happened over the past two years that invalidates the principal reasons we’ve laid out for owning precious metals. [This article] looks at the key reasons why we originally recommended gold and silver plus, sadly, several new drivers that have developed recently all of which confirm that the bruised precious metal investors out there should still sleep well at night, secure that the foundational rationale for holding gold and silver remains intact. Read More »
3. The Gold Story Is NOT Over. Far From It. Here’s Why
Is it time to admit defeat, sell our positions, slink into a cave, and lick our wounds? Absolutely not. The only thing that changed over the past 60 days was the price of gold, and perhaps the mainstream’s perception of our industry. The realities of the fiscal and monetary state of the world, however, did not. Amid the ongoing rollercoaster ride of gold prices, clearheaded thinking reveals reasons to be optimistic. Read More »
4. Gold to Breach $1,350 Soon, Then Plummet to $1,200/1,250 & Ultimately Drop to $1,000/1,100
5. Gold:Silver Ratio Suggests Much Higher Future Price for Silver – MUCH Higher!
The majority of analysts maintain that gold will reach a parabolic peak price somewhere in excess of $5,000 per troy ounce in the next few years. Given the fact that the historical movement of silver is 90 – 95% correlated with that of gold suggests that a much higher price for silver can also be anticipated. Couple that with the fact that silver is currently greatly undervalued relative to its average long-term historical relationship with gold and it is realistic to expect that silver will eventually escalate dramatically in price. How much? This article applies the historical gold:silver ratios to come up with a range of prices based on specific price levels for gold being reached. Words: 691 Read More »
6. Charts Provide Certainty – Not Opinion: Here’s What They Say About Gold & Silver
Charts provide certainty, for they are absolute and the final word at the end of day, week, month, etc. There can be no dispute over a bar’s high, low and close, plus the volume, for whatever the time period under consideration. There is a high degree of logic within them and, while there can be differences of opinion over their interpretation, establishing a fixed set of parameters can mitigate most any potential dispute. So just what are the charts saying about the current trend in gold and silver? Let’s take a look. Read More »
7. What’s the Difference Between 1 Gold Karat, 1 Diamond Carat and 1 Troy Ounce?
You have no doubt read countless articles on the price of gold costing “x dollars per ounce”, own a gold ring or some other piece of gold jewellery and/or wear or have bought/plan to buy a diamond ring but do you really understand exactly what you are buying? What’s the difference between 1 troy ounce of gold and 1 (regular) ounce? What’s the difference between 18 and 10 karat gold? What’s the difference between a .75 and a 1.0 carat diamond? Let me explain. Words: 1102 Read More »
8. These Sites Are the BEST Places to Buy Gold & Silver Online – Here’s Why
Our review of the best places to buy gold online…[are] dependent on what your goal with the gold is — amassing physical bullion for financial security or to speculate on gold prices. Below are strategies and recommended dealers for each approach: Words: 532 Read More »
9. Don’t Save Money, Save Gold and/or Silver! Here’s Proof of Why It is the Way to Save
 munKNEE.com Your Key to Making Money


If you don’t think that PM’s are now being manipulated by the Central Banks, then I think that you should not be investing in buying additional PM’s!
BUT
If you believe that the Central Banks cannot continue to keep printing paper money forever then what is happening now is nothing but a huge buying opportunity!
Consider: As the Central Banks further restrict credit and loans to us, what other options besides selling PM’s (at a large discount )do small investors have, if they want to grow what is left of their portfolios? This is a move to drive a stake into the hearts of all those that are still holding PM’s; while at the very same time, these same Central Banks (who are in on the deal) are scooping PM’s up (using their own printed paper money) at very low prices.
My gut feeling is that when the PM “reversal” happens, it will be so extreme that most small investors will not be able to jump on-board before the prices have skyrocketed relative to where they are currently, due to the market dynamics that favor the really big investors.
Here is a great PM question for you, Are the Central Banks still buying Gold, and if so why?
I look forward to your comments!