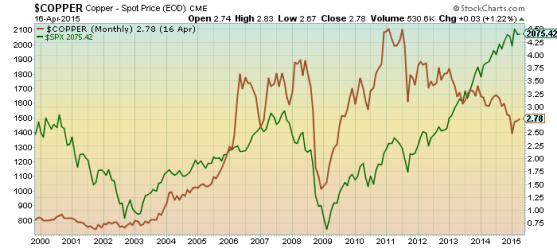
The large gap between the price of copper and U.S. indices is a warning  sign that investors should take into consideration before starting new positions. [Here’s why.]
The above comments, and those below, have been edited by Lorimer Wilson, editor of munKNEE.com (Your Key to Making Money!) and the FREE Market Intelligence Report newsletter (see sample here) for the sake of clarity ([ ]) and brevity (…) to provide a fast and easy read. The contents of this post have been excerpted from an article* by from a post on SeekingAlpha.com which was originally entitled The Sky Is Falling Part 3: Don’t Forget About Copper which can be read in its unabridged entirety HERE. (This paragraph must be included in any article re-posting to avoid copyright infringement.)
…US growth has been tied to copper and other manufacturing related materials over the past decade…[which] isn’t surprising considering that an increase in demand requires purchasing confidence and strong business…[but] market participants have recently ignored the typical correlation between copper and the markets [as shown in the chart below]:

(Source: ProfitConfidential.com)
…The almost perfect negative correlation [as shown above] is a major warning sign. Lower copper prices mean one of two things:
- falling demand…
- Falling demand hints to a declining need for copper, and as orders dry up, suppliers need to work harder to compete for business, thereby lowing the price of copper even further.
- a strong USD
- A strong USD is also weighing in on the price action, but oddly not as one would expect. The U.S. company, Freeport-McMoran Copper & Gold is the second largest producer of copper and thus currency volatility that would cause copper to slide should be negated slightly because of domestic operations.
This correlation will continue in the long-term, at least until there is a more affordable and better replacement for electricity conduction and wiring. Whether easing will cause the divergence to grow in the short-term is virtually unpredictable, however, the large gap between the commodity price and US indices is a warning sign that investors should take into consideration before starting new positions.
*http://seekingalpha.com/article/3523356-the-sky-is-falling-part-3-dont-forget-about-copper?ifp=0
Related Articles from the munKNEE.com Vault:
1. The Problems With Copper Seem Insurmountable – Here’s Why
Copper is among the three most used metals in the world, and high quantities of the red metal must be mined every year but the problem is that copper is not being discovered fast enough to meet upcoming demand. There are several reasons as this infographic illustrates.
2. Copper’s Largest & Most Important Producing Countries
Copper is one of the most important and popular industrial metals in the world. With 3% per year production growth since 1900, approximately 16 million tons of the metal was produced in 2011, according to the International Copper Study Group. Below, we outline some of the largest and most important copper-producing nations across the world:
3. Alert! Copper Has Plummeted – Plunge In S&P 500 Could Be Next – Here’s Why
Copper has just met the lower resistance line of its descending triangle pattern and should it break through that resistance the price for copper could fall like a stone. That, in turn, would have a MAJOR “watch out below” impact on the future level of the S&P 500. Let me explain.
4. Copper Waterfall Suggests Drop in S&P 500 is Coming – Here’s Why
Dr. Copper, as it is affectionately known, has been a longstanding barometer of economic growth and historically has shown a high positive correlation to the S&P 500. However, over the past several quarters there has been an increasingly large disconnect between the performance of major indices and the price of copper. With copper hitting YTD lows it suggests that there is less demand and that growth is slowing down and this, in turn, forecasts lower levels for the S&P 500. Words: 420
 munKNEE.com Your Key to Making Money