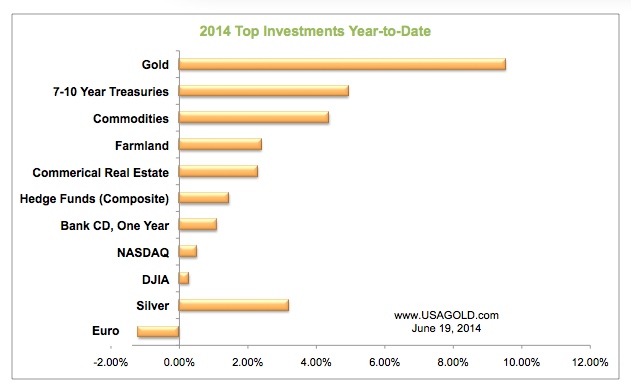
Gold remains the best performer on the year thus far — better than Treasuries, the euro, commodities, farmland, NASDAQ and the Dow Jones Industrial Average, better even than silver – but what about the rest of 2014?
The above comments are edited excerpts from an article by Michael J. Kosares (usagold.com) entitled Three developing gold market situations to monitor for the rest of 2014.
The following article is presented courtesy of Lorimer Wilson, editor of www.munKNEE.com (Your Key to Making Money!) and has been edited, abridged and/or reformatted (some sub-titles and bold/italics emphases) for the sake of clarity and brevity to ensure a fast and easy read. This paragraph must be included in any article re-posting to avoid copyright infringement.
Click on Facebook for latest articles on gold/silver & economic/financial matters from munKNEE.com
Click on Twitter for latest tweets from munKNEE.com
Subscribe to the FREE Market Intelligence Report newsletter (sample here)
Kosares goes on to say in further edited excerpts:
We are monitoring three developing situations that we believe could have a profound impact on gold demand during the remainder of the year — driving forces that could provide impetus for a classic gold run that could begin with a summer surprise.

1. A possible stock market meltdown
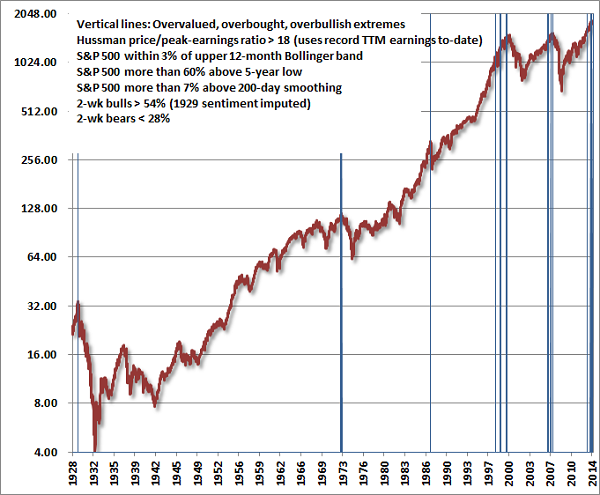
Jon Hussman (Hussman Strategic Advisors) is predicting a stock market correction in the near future that will wipe out 38% to 50% of current valuations. When it comes to the stock market, we give Hussman’s analysis a bit more play on these pages than others simply because he called both the 1987 and 2007-08 crashes — a feat few, if any fund managers can chalk up on their resumes. Hussman sees the same build-up of overvaluation now that he saw then and has issued warning to his readers. Some will be put-off by Hussman’s Doomsday thinking, but we should keep in mind that “I didn’t see it coming” was the most commonly verbalized refrain following the last stock market meltdown in 2008.
In a piece written for The Casey Report Hussman says,
“Is this time materially different from 1929, 1972, 1987, 2000, or 2007? We doubt it.
In the chart of overvalued, overbought, overbullish extremes below, I’ve replaced the Shiller P/E (which is a lightning rod) with a variant that I introduced in the 1990s, basing the P/E multiple on the highest level of trailing earnings observed to date surely an optimistic and forgiving measure today, given that profit margins are about 70% above historical norms, but one that signals rich valuation regardless.
We certainly can’t rule out movements further up the mountain (though to us, 2013 was largely a replay of 1999), but those movements are likely to appear small in the context of what will be erased over the completion of the cycle.”

He concludes, “Yet as much as we focus on the long-term good, equilibrium creates an unfortunate constraint: by encouraging one investor to defend their financial security by selling overvalued stocks, the result is that someone else must end up buying the stock at these same levels. That poor soul, we expect, is likely to be worse off for the trade…In order to profitably exit that speculation, someone else must be guaranteed misery. In a financial market where price signals encourage savings to be allocated toward productive uses, what helps an individual investor often helps the entire economy but in a severely distorted and speculative market, any effort to help one investor is really quite a zero-sum game that requires someone else to be injured. This is just an unhappy result that years of quantitative easing have now foisted upon us.”
In 2008, a massive move to gold accompanied the stock market decline and the descent into the Great Recession. The price of gold, after a brief decline, rose over 70% in a little over twelve months. The Dow Jones Industrial Average in contrast lost over 50% of its value. To put that in dollar terms, $1,000,000 in stocks would have become about $500,000. One million in gold would have become $1,700,000. That amounts to a $1.2 million portfolio swing. Those numbers — a real life example — are worth a treatise on the value of a gold diversification in uncertain times.
2. A potential adjustment in the gold-oil price ratio
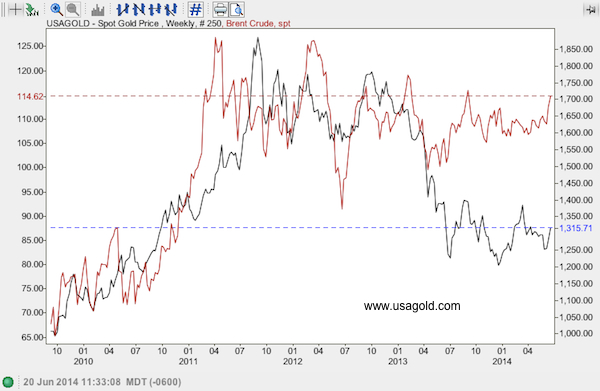
Ever since Saudi Arabia’s King Ibn Saud traded 35,000 old British sovereigns for oil concessions in his kingdom [back in] 1933, there has been a connection between oil and gold. The good king understood the difference between the value of gold and a paper promise. At the time, the British sovereign…could buy about ten barrels of oil. (British sovereigns at the time were valued at $8.24 and a barrel of oil was 85¢.) Today a British sovereign’s melt value is roughly $71 and a barrel of oil is about $115. For the British sovereign to buy what it bought in terms of oil in 1933, it would have to be valued at $1150 or about $4900 per troy ounce — a statistic that gives you an inkling just how undervalued gold might be for the long term.
Even the short term, as suggested by the chart below, looks good with respect to the gold/oil differential. It suggests gold is undervalued, perhaps severely undervalued. Given the situation in Syria and Iraq and the general heating up of the civil war between Sunni and Shiite across the Middle East, it is difficult to believe that the disparity will resolve itself in significantly lower oil prices. A more likely scenario under the circumstances would be for gold to play catch-up.

Says Larry Edelson in a recent Real Wealth Report: “Global conflict is now ramping up…[and] they will turn out to be some of most important events of your lifetime — events that will shape your financial future and the financial future of all those you love for the next 50 years. Unfortunately, however, most people still don’t understand them. They don’t know what’s happening — let alone what to expect. They haven’t connected the dots to gold – and they don’t realize how deeply the conflicts tie back to oil and energy.”
3. A possible make-up rally based on gold’s historic undervaluation when compared to inflation
“That light at the end of the tunnel? It’s an oncoming train” was a popular joke from the 1970s [and] that oncoming train, as far as financial markets are concerned, might well be in the form of real unemployment and inflation numbers that the Washington’s politicians and Wall Street’s money managers don’t want you to know about…
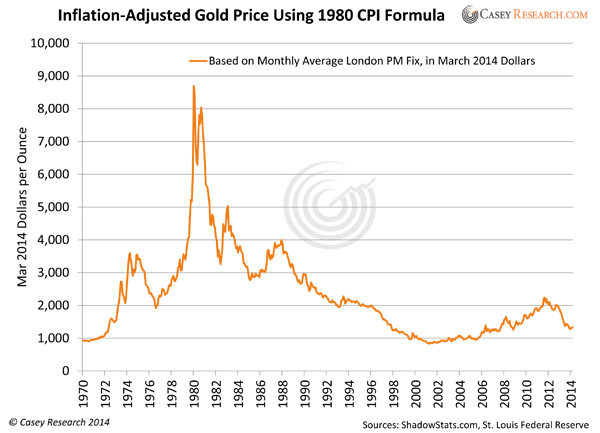
Fortunately,…someone has gone to the trouble to assemble numbers for public consumption that tell the real story on inflation and unemployment. That someone is economist John Williams of Shadow Government Statistics, the widely used website for those who simply do not believe the numbers circulated by the federal government. At present Williams has the inflation rate at nearly 10% (BLS-CPI = 2%) based the BLS’ 1980 statistical methodology…A chart on the inflation-adjusted price of gold using Shadow Stats numbers…speaks for itself.

Editor’s Note: The author’s views and conclusions in the above article are unaltered and no personal comments have been included to maintain the integrity of the original post. Furthermore, the views, conclusions and any recommendations offered in this article are not to be construed as an endorsement of such by the editor.
*http://www.usagold.com/forms/newsletter_backissue.php (© 1997-2013 CPM, INC./ USAGOLD All Rights Reserved)
Related Articles:
1. Bear Phase in Bull Market for Gold Will End This Summer – Here Are 30 Reasons Why
Below are the 30 reasons, 23 new and 7 set in cement, of why the Bear phase in the bull market for gold ends this summer without any new lows. Read More »
2. Here’s Why Gold Has Bounced Higher – And Will Go Even Higher Over the Next 6 Months
With the price spike in gold this week (spot gold up nearly 3% and gold stocks up around 7%) some of the perpetual gold naysayers are suggesting the metal had shifted to overbought status but that just is not the case. Below I explain why gold has taken off. Read More »
3. Gold & Silver Still Have More Room to Run – Much More! Here’s Why
When we look at the price of silver and gold, especially when adjusted for inflation, we see a lot of upside potential. Because we believe that the most exciting part of a bull market is at the end of the move, we believe that the best may still be ahead of us. Let us explain with the use of a number of very enlightening charts that support our contention. Read More »
4. Incredible Bounce Coming Soon In Gold & Silver – Here Are 5 Reasons Why
Get ready for an incredible bounce higher in the gold & silver junior miner sector. Here are five reasons why. Read More »
5. Gold Should Be At Least At $2,040/ozt. – Here’s Why
The value of gold relative to oil (Brent Crude) is an embarrassing 11.2 to 1 ratio – way below its historical average – thanks to the manipulation by the Fed and member banks. When the price revalues higher it will do so SHARPLY and it will be PAINFUL for those on the wrong side of the trade or in worthless paper assets. Let me explain why that is the case. Read More »
6. Gold Should Bounce Sharply Higher – Here Are 10 Reasons Why
Is it time to throw in the towel? Is the bull market in precious metals really over? I don’t think so because my analyses suggest that nearly all of the fundamental factors that have been driving the gold price higher in the past decade have only strengthened in the past two years. Now that the correction has most likely run its course, I expect gold to bounce sharply higher. Here are 10 reasons why. Read More »
 munKNEE.com Your Key to Making Money


Overnight, Silver could become #2 on the first chart listed above (or higher) should Gold suddenly become hard if not impossible to obtain, since investors would then shift to buying Silver and the other PM’s.
Also we are only about halfway throngh 2014.
GOT Silver?