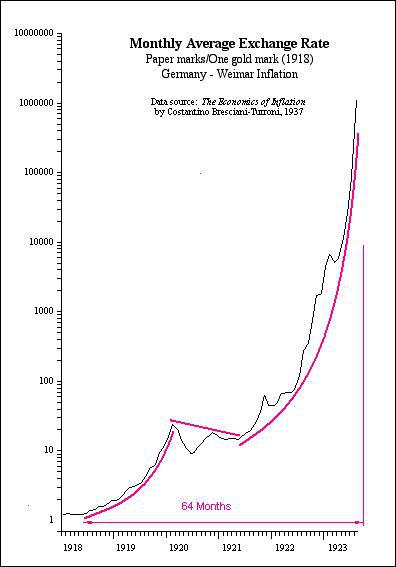
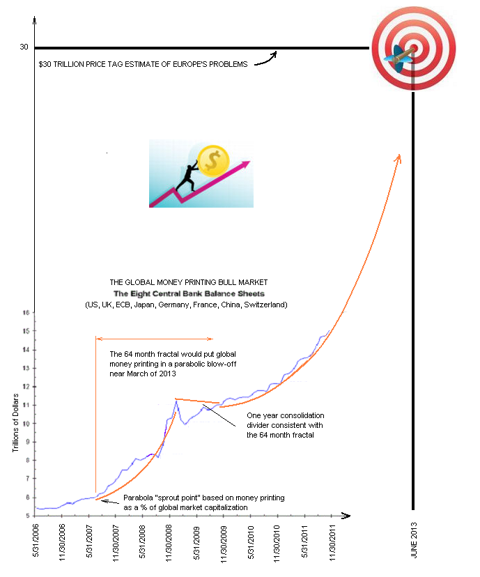
The 21 month time frame for the next gold peak, the $30 trillion price tag for the debt, and the 64 month bull market fractal for money printing are all coming together squarely at the same date – June 2013. Words: 1350
So says Bruce Pile (http://goodstockinvesting.blogspot.ca/) in edited excerpts from his original article* as posted on SeekingAlpha.com
This post is presented compliments of Lorimer Wilson, editor of www.munKNEE.com (Your Key to Making Money!) and the FREE Intelligence Report newsletter (see sample here). The post may have been edited ([ ]), abridged (…) and/or reformatted (some sub-titles and bold/italics emphases) for the sake of clarity and brevity to ensure a fast and easy read. You can also “Follow the munKNEE” daily posts via Twitter or Facebook. Please note that this paragraph must be included in any article re-posting to avoid copyright infringement.
Pile goes on to say, in part:
1. The dollar amount for the global debt problem
At this point, it is mostly in Europe, where the banks have about four times the assets of the US banks and are in about 10 times the trouble. There is some consensus on a price tag for all this trouble….about $30 trillion, all of which is unpayable, other than with printing press money, or things which are similar but amount to the same thing….
2. The price of gold
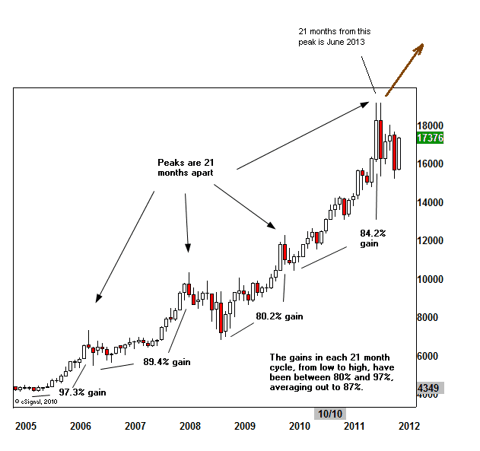
It is debated on just how they relate, but the debt mountain and gold are closely linked….One of the patterns in gold, as noted by David Nichols, is a repeat of major peaks 21 months apart. He illustrates it thusly:
The last peak was last August, and 21 months from then puts us at June, 2013. A sharp run-up in gold into next June is implied.
3. The bull market fractal in money printing
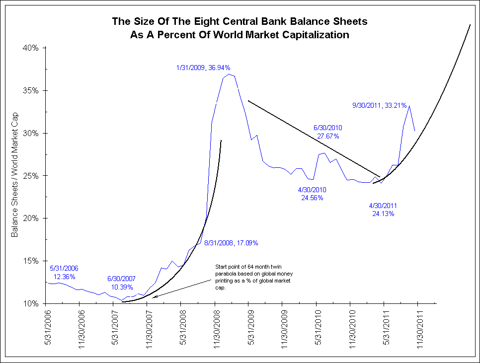
…The components of the fractal are twin parabolas separated by a downtrend of about a year. The trickiest part of establishing a time line for the fractal is determining the “sprout point” for the first parabola. This is typically a change in trading behavior from a sleepy, sideways or gently rising pattern to a parabolic climb….[In this case,] I combined the global eight central bank charts together into one graph. This was been done on an absolute basis and as a percent of world market capitalization. Because the normal condition (in a Keynesian sense) is market cap and central bank balance sheets growing in tandem, I used the percent of market cap chart to see the sprout point, where this ‘natural’ condition changes:
[In the above chart] we see that the twin parabola fractal has formed and we are well on our way into the second parabola. Note the percentages on this chart. It is absurd to have over a third – approaching half of the world’s ‘free’ market capitalization – be central planning/central bank interference. Their intentions were good but, then, so were the Soviet Union’s 5 year plans.The 64 month fractal would put money printing in a parabolic blow-off near March 2013…

Why Own Gold
Those that fear deflation fear owning gold but, to me, the whole inflation/deflation gold debate is a moot point. I think J.P. Morgan had it right when he issued his axiom “Gold is money. Everything else is credit”. Think about it. Besides gold, the only other types of money are currency and credit. Currency is just an IOU from a government that can change how much they owe you with the flip of a printing press switch. In the Depression of the 30s, there was no inflation of the currency, it was the credit world that was messed up, and gold was grabbed up by the government (at a sharply marked up price) and gold miners skyrocketed while the rest of the stock market languished. In the ’70s, we had no credit collapse, but the currency, unhinged from gold in ’71, was eaten alive with inflation, and gold went through another massive bull market.
It is really the monetary instability that gold reacts to, whatever its form. In our present mess, one wonders if they will over-print or under-print to manage the debt write-off damage to the money supply in the economy but does it really matter to the gold bull market? Whether it’s the currency or the credit that gets whacked, the third form of money is going to benefit. Gold is money. Everything else is credit.
Why Own Gold & Silver Royalty Stocks
If you really want something that looks like a complicated, bond based, hedged-in-all-directions investment vehicle but with returns more like that of a risk asset, look at the gold royalty stocks. There are just two big, well diversified names here, Royal Gold (RGLD) and Franco-Nevada (FNV).
If you look at a performance comparison chart of RGLD alongside GLD, the gold price ETF, or AGQ, the 2X silver price ETF, or the S&P 500, or any of the gold stock ETFs over the past few years, you see a smooth, big outperformance of RGLD over all of these alternatives. You can’t see much evidence of any big Dow crashes or gold stock crashes for that matter in the chart for RGLD. This investment has nearly tripled the past 5 years and is currently near its all time high despite the gold stock malaise. FNV is very similar but has actually outperformed RGLD and is at a new all time high.
What is so different about these investments?
They are essentially a finance company that provides capital to miners in exchange for an agreed upon percent of their future gold sales. This one simple concept accomplishes a boatload of defenses against market uncertainties. For one thing, it takes individual gold miner risk out of the equation.
Why do they vastly outperform any gold stock index?
Well, they strike these deals based on a price of gold at the time and subtract some cash cost for production at the time. Then the miner uses the capital given to them to develop production over the years while both the price of gold and the cost of production go up. By the time the percent of production comes rolling in, RGLD is making a production profit that is in another ball park from the miners. Buying RGLD has been compared to buying a call option on gold with no expiration date. It’s also like a twenty year gold futures contract. The income statement for the company is marked by a net profit margin that can run around 40% with the biggest single expense being income tax! Gold could drop dramatically and RGLD would be profitable. As of early 2010, most of the deals for Royal Gold’s mines were struck at a $480-$780 gold price.
The Royalty Gold Model
The gold royalty model is perfect for credit problems and deflation. In the 2008 crunch, miners who derived much of their revenue from base metals associated with their mines found both their product prices plummeting and their capital credit impaired. Royal Gold was able to strike lucrative deals with these hurting miners. Both RGLD and FNV aren’t hurt by deflationary base metal problems as so many miners are who must extract many metals together for their business model. The gold royalty companies can zero in on just deeply discounted gold.
These companies are ideal for investor angst over inflation/deflation periods and that’s probably what we will have for many years if no global debt solution is found – and we will have a compressed, even more dangerous period, if a global debt jubilee is attempted.
[Do you own physical gold or a gold ETF? Better yet, do you own stock in RGLD or FNV? Best of all, do you own Franco Nevada’s (FNV) warrant “A” which does not expire until 2017 or Sandstorm Gold’s (SSL) warrant “A” that expires in 2015 and warrant “B” warrant that expires in 2017? Those who are knowledgeable regarding the leveraged returns such securities will generate compared to gold and gold mining stocks do. Shouldn’t you?]
*http://seekingalpha.com/article/803111-a-triangulated-forecast-for-june-2013
Related Articles:
1. David Nichols: Expect to See $2,750 – $3,000 Gold By June 2013 – Here’s Why
The interim peaks in gold have been spaced 21 months apart over the past 6 years and have seen gains from 80.2% to 97.3%. As such, given the fact that the low of this last correction came in at $1,524 four months ago, we can expect gold to reach a new peak price of $2,750 to $3,000 in 17 months time (i.e. June/July 2013). [Let me explain in more detail.] Words: 976
2. von Greyetz: Gold Going to $3,500-$5,000 in 12-18 Months – and $10,000 Within 3 Years!
There will be a catalyst coming soon, probably some concerted action of money printing between the Fed, IMF and the ECB. That will happen as a result of the economies, worldwide, collapsing….The catalyst could come from anywhere but the money printing will be part of the next move in gold, that’s for certain….[and it] will lead to collapsing currencies, and investors buying gold at any price…I see gold reaching $3,500 to $5,000 in the next 12 to 18 months. Within 3 years, I see the gold price reaching at least $10,000.
3. The “80-20 Rule” Suggests Gold Will Reach $8,300/ozt in Spring of 2015!
The “Pareto principle” – it’s often referred to as the “80-20 rule” – states that 80% of the effects of something come from just 20% of the causes (that is that 80% of people control 20% of the wealth, that 80% of sales come from 20% of your customers, etc.) and a new report by Erste Group, the Austrian investment bank, says this principle can be applied to bull markets as well, including the current bull market in gold, and following this line of thinking, you get an $8,300 price target for gold by the spring of 2015. Words: 285
4. Update: 51 Analysts Now Maintain that Gold is Going to $5,500 – $6,500/ozt. in 2015!
Lately analyst after analyst (161 at last count) has been climbing on board the golden wagon with prognostications as to what the parabolic peak price for gold will eventually be. That being said, however, only 51 have been bold enough to include the year in which they think their peak price estimate will occur and they are listed below. Take a look at who is projecting what, by when and why. Words: 644
According to a recent Elliott Wave theory analysis gold is about to go parabolic reaching $3,495 in June 2013, $6,233 in April 2014, $10,899 in Sept. 2014, $18,712 in December 2014 and culminating in a parabolic peak price of $31,672 on January 16th, 2015! See the chart below. Words: 600
6. New Analysis Suggests a Parabolic Rise in Price of Gold to $4,380/ozt.
According to my 2000 calculations, if interest rates and inflation stay constant over the next 2 years, we could expect to see (with 95.2% certainty) a parabolic peak price for gold of $4,380 per troy ounce by then! Let me explain what assumptions I made and the methods I undertook to arrive at that number and you can decide just how realistic it is. Words: 740
7. Gold Bugs: Here’s How to Make the Most of the Continuing Bull Market in Gold!
All you gold bugs out there (and budding gold bugs too!) should find this article of extreme interest. With gold about to make a major move upwards in price NOW is the time to position your gold-investment allocation to maximize your dollars deployed and returns generated. Those in the know will not be investing in physical or paper gold, or even the stocks of the miners, but in the long-term warrants of the very few mining companies that offer such an opportunity. This article provides a primer on the MAJOR advantage that long-term warrants have in a market upleg and identify the specific warrants that are available. Words: 1037
8. Interested in Buying Gold or Silver Mining Company Warrants? Here’s How
Buying and selling warrants associated with commodity-related companies (including those of gold and silver miners) can be very confusing if you are not aware of the unique information required to do so and understand just how to go about it. Below you will find all the information you need to know on the subject. Words: 2110
 munKNEE.com Your Key to Making Money


