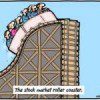
Last year’s “Sell in May” period was only the third time since the turn of the century that stocks have posted double-digit gains from May through October so, with stocks still near all-time highs as the calendar flips to May, do the law of averages suggest we’re on the brink of a major pullback over the next six months?
So says Chris Preston (wyattresearch.com) in edited excerpts from his original article* entitled Can the Market Defy “Sell in May” Again?.
The following article is presented by Lorimer Wilson, editor of www.munKNEE.com (Your Key to Making Money!), www.FinancialArticleSummariesToday.com (A site for sore eyes and inquisitive minds) and the FREE Market Intelligence Report newsletter (sample here; register here) and has been edited, abridged and/or reformatted (some sub-titles and bold/italics emphases) for the sake of clarity and brevity to ensure a fast and easy read. This paragraph must be included in any article re-posting to avoid copyright infringement.
Preston goes on to say in further edited excerpts:
The numbers don’t lie. The “Sell in May” phenomenon is ordinarily very real.
- Since 1950, the average gain in the Dow Jones Industrial Average was a mere 0.3% from May 1 through October 31. From November through April, those numbers jump to +7.5%.
- Even recent history supports the “Sell in May” theory. Over the past five years, the average gain in the S&P 500 from May through October was 3.9%. The November through April gains were almost triple that, at +11.5%.
- The market has never posted back-to-back years of double-digit gains during the “Sell in May” period. In fact, only once since 1997 have stocks risen more than 6% in back-to-back “Sell in May” periods.
The above numbers suggest that last year’s booming “Sell in May” period, when the S&P 500 rose 10% from May to November, outpacing the six months that preceded it and the six months afterwards, was an aberration.
Market valuation isn’t on investors’ side as we enter May either.
- Right now, stocks are dangerously overbought. The S&P 500 is trading at 15.7 times next year’s earnings – higher than the five-year average of 13.2, and the 10-year average of 13.8.
- It’s also the highest the S&P’s forward PE has been since 2005.
- It’s been nearly three years since a correction of more than 10%.
The addition of the above would suggest that a major pullback is imminent but here’s the thing about this rally, though: it has defied all logic.
Countless times over the past year, Wall Street pundits have been calling for a mass correction. Each time, stocks have risen higher than ever before. Another near-default by the U.S. government, sequestration cuts taking effect, an unemployment rate that’s been slow to improve – none of it has managed to slow this rally – and those are real, tangible factors that directly impact the U.S. economy. By comparison, a seasonal phenomenon such as “Sell in May” seems like a much smaller concern for investors.
Conclusion
It really comes down to what you believe in more:
- 63 years of data suggesting that it would be foolish to completely ignore history – and that history says we should expect a decline in the next six months, or
- the power of this market rally which, time and again in the last two years, has won out.
Editor’s Note: The author’s views and conclusions in the above article are unaltered and no personal comments have been included to maintain the integrity of the original post. Furthermore, the views, conclusions and any recommendations offered in this article are not to be construed as an endorsement of such by the editor.
*http://www.wyattresearch.com/article/sell-in-may/ (© 2013 Wyatt Investment Research)
Related Articles:
1. 2 Stock Market Indicators Are Saying “Be careful, don’t get caught up in the euphoria”
In the midst of all the optimism we see towards key stock indices these days, there are two leading indicators that are flashing warning signals. They say, “Be careful, and don’t get caught up in the euphoria.” Read More »
2. Are Stock Market & U.S. Dollar About to Crash? Will Gold Be the Major Benefactor?
Something is clearly out of whack. Gold has failed to push higher against the backdrop of a lower U.S. dollar for the first time in over a decade and, with pressure on the dollar increasing, the failure of support could ignite a massive decline. Is gold preparing to launch this time? Read More »
3. Beginnings of Massive Stock Market Correction Developing: Don’t Delay, Prepare Today!
No stock can resist gravity forever. What goes up must eventually come down. This is especially true for stock prices that become grotesquely distorted. We have been – and still are – living in another dotcom bubble, and – like the last one – it is inevitable that it is going to burst. Read More »
4. Stock Market Will Collapse In May Followed By Major Spike in Gold & Silver Prices! Here’s Why
The unintended consequences of five years of QE are coming home to roost! In May or early June the stock market parabola will collapse…followed by a massive inflationary spike in commodity prices – particularly gold & silver – that will collapse the global economy. Read More »
5. 3 Historically Proven Market Indicators Warn of an Impending Market Top
It’s frustrating to see key stock indices keep pushing higher when historically proven market indicators are all warning of a crash ahead. Irrationality is exuberant to say the very least, and that’s why I believe this rally is counting its last days. Read More »
6. The Stock Market Is a Risky Place to Be – Here’s Why
With both the fundamentals and the technicals saying the stock market is a risky place to be, we await its crash back to reality. Here’s why. Read More »
7. We’re on the Precipice of a 50% Drop in the U. S. Stock Market! Here’s Why
Warren Buffett’s favorite indicator – the ratio of the value of U.S. stocks to GDP – is seen by him as a reliable gauge of where the market stands and these days it suggests that all the main indexes are pointing to an imminent 50% crash. Read More »
8. End of “Wall Street Party” Will Be a Catastrophe! Here’s Why
The markets are considerably, fantastically overbought and that whatever happens after this “Wall Street Party” is going to be a sort of catastrophe. Here’s why. Read More »
9. This Chart of the Dow Suggests “Bring on 2014 – We Ain’t Seen Nothin’ Yet!”
The Dow is up almost 28% but the chart below showing how it’s 12% annualized gain over the past 5-years compares with past bull markets suggest we are probably not at a top – that “We ain’t seen nothin’ yet!” Take a look. Read More »
10. Some Factors to Consider As To Whether the Market Will End UP or DOWN in 2014
What is the likely market return in the coming new year? This articles tries to answer that question by presenting technical and fundamental market factors that are influencing the market in the coming year. Some of these factors point to a positive market return this year while others point to negative influences. Let’s take a look. Read More »
11. Stock Market Bubble Going to Burst & Unleash Destructive Forces on Global Economy
The Fed has manufactured a parabolic move in the stock market…which is much more aggressive (and thus even more unsustainable) than witnessed at either the 2000 or 2007 stock market tops. Parabolas always collapse – there are never any exceptions – so when the pin finds this bubble it’s going to take down not only our stock market, but unleash a destructive force on the global economy. Read More »
12. Warren Buffett’s Favorite Valuation Metric Suggests Stock Market Is OVERvalued by 15%
Here’s some perspective on the potential value of the U.S. equity market using Warren Buffett’s favorite valuation metric – total stock market capitalization relative to GDP. Read More »
 munKNEE.com Your Key to Making Money


My feeling is that the US Dollar will lose buying power as PM’s reclaim some of their lost value, or if there is additional conflict in the World the changes in value of PM’s could easily be doubled if not more from their present value.