With the gold price in dollars breaking decisively the 200 day moving average but with volatility across a broad range of asset classes close to, or at, historic lows…this article looks at what patterns occur in equity and gold prices during both up and down trends and how to adjust your portfolio accordingly.
The following article is presented by Lorimer Wilson, editor of www.munKNEE.com (Your Key to Making Money!), www.FinancialArticleSummariesToday.com (A site for sore eyes and inquisitive minds) and the FREE Market Intelligence Report newsletter (sample here; register here) and has been edited, abridged and/or reformatted (some sub-titles and bold/italics emphases) for the sake of clarity and brevity to ensure a fast and easy read. This paragraph must be included in any article re-posting to avoid copyright infringement.
- The index is said to be in an up-trend when the current level is above the moving average and
- the index is said to be in a down-trend when the current level is below the moving average.
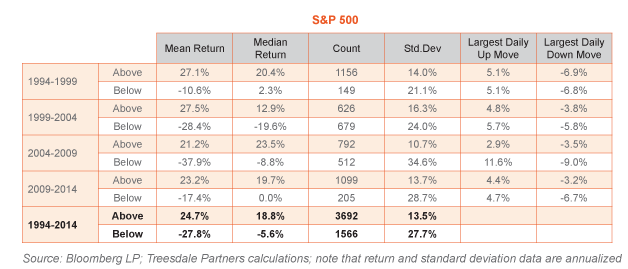
Note that the 200 day moving average is used here as an indicator of market trend simply on the basis that it is a widely watched trend indicator by market participants but in any case, it can be shown that the general results presented here are not particularly sensitive to the specific choice of trend indicator.[Below is a table of]…the 20 year period from 1994-2014…[with] 5 year intervals to help identify any potential changes in trend.

- over the full 20 year period when the market was trending lower:…
- volatility (i.e. the standard deviation) was…[twice as much],
- in the 5 year sub-periods
- volatility was also twice as high and this pattern was also evident in each 5 year sub-period and
- the largest daily up and down moves…occurred...
Stay connected
- Subscribe to our Newsletter (register here; sample here)
- Find us on Facebook
- Follow us on Twitter (#munknee)
- Subscribe via RSS
Gold Price ($US) Movement Patterns
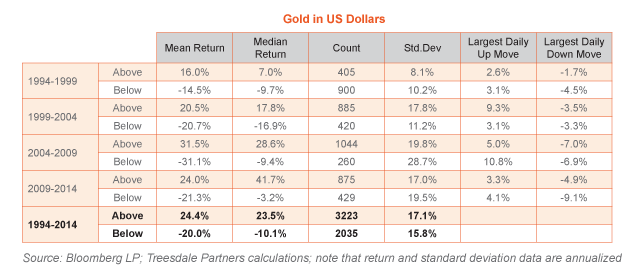
… [As shown in the table below, gold prices]:
- over the full 20 year period:
- volatility was approximately 8% higher during periods in which the gold was trending up which is the reverse of what was observed in equity markets.
- [In the 5 year sub-periods]…
- there was less consistency over time with higher volatility being experienced in both up and down trending markets.
This is a surprising result as most assets would expect…higher price volatility to be associated with falling prices….[This] could be related to its characteristics as a “defensive” asset during periods of market stress…[when] investors often…buy gold as a temporary store of value and as a way to protect the value of their portfolios as equity markets…fall…
Gold Price (Euro) Movement Patterns
Historically, the dollar has demonstrated defensive qualities with many global investors choosing to switch from other currencies into the US currency during crisis periods. When an investor buys gold in dollars, they are not just expressing a bullish view on gold but also a bearish view on the dollar.
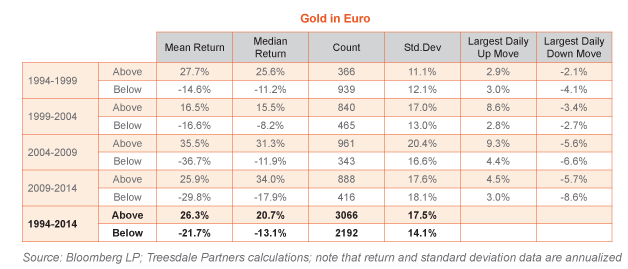
If the dollar rises in value during a period of market stress, this would hurt the price of gold in dollars and thereby reduce its effectiveness as a defensive asset. To investigate this relationship further we conducted the same trend/volatility analysis using the price of gold in euro terms [as illustrated in the table below]..

- Over the full 20 year period, gold in euro terms was:
- 24% more volatile when trending higher (above the 200 day moving average) than when trending lower.
- In 3 out of the 5 (five) 5 year sub-periods:
- volatility was also higher in up-trending markets.
Conclusions
What are some of the implications of these results?
- In equity markets there may be some benefit to reducing exposure during periods when the market is trending lower (as these periods tend to be associated with significantly higher volatility in prices).
- …[While]reducing equity market exposure in a down trending market might reduce the ability to capture some of the large daily up moves (the biggest daily moves – either up or down – happen when the markets are trending lower), it might enable the investor to avoid some of the large drawdowns associated with falling markets.
- In gold we observed the reverse pattern;
- there may be some benefit to assessing the strength of the trend in the gold price as a way to potentially quantify the benefit to adding gold exposure to a portfolio during periods of market stress.
In other words, [the implications from the above findings are that:]
- there may be some signaling information to be mined from price trends in equity and gold prices which can help to optimize portfolio weight decisions.
The key point to stress then is that the benefit from observing price trends is not so much on being able to better forecast future market direction but to:
- assess the probabilities for increased price volatility (either upwards or downwards) and to
- make appropriate adjustments to portfolio weights.
Editor’s Note: The author’s views and conclusions in the above article are unaltered and no personal comments have been included to maintain the integrity of the original post. Furthermore, the views, conclusions and any recommendations offered in this article are not to be construed as an endorsement of such by the editor.
*http://seekingalpha.com/article/2256353-is-the-gold-market-more-volatile-when-trending-higher-or-lower?ifp=0 (© 2014 Seeking Alpha )
Related Articles:
1. Watch These 12 Data Points For Future Direction of Gold & Stocks
A big short term move in both stocks and gold is probably fairly imminent as periods of extremely low volatility like we are currently experiencing are invariably followed by periods of very high volatility that are brought about by a trigger event of some sort. There will probably be an advance warning somewhere, in a corner of the markets that perhaps isn’t widely watched…[so] keep a close eye on these 12 inter-market signals. Read More »
2. Ride the Market Waves With These 6 Momentum Indicators
It is hard to know what to buy or sell let alone just when to prudently do so. Thank goodness there are indicators available that provide information of stock and index movement of a more immediate nature to help you make such important decisions. This article describes the 6 most popular Momentum Indicators. If ever there was a “cut and save” investment advisory this is it! Words: 1234 Read More »
3. The Best Stock Market Indicator – Ever
Below is a description of what I believe to be the best stock market indicator – ever. I am referring to the percentage of S&P 100 stocks above their 200 DMA which gives traders a clear early warning signal of impending serious market downturns and later safe re-entry points. Read More »
4. Are Stock Market & U.S. Dollar About to Crash? Will Gold Be the Major Benefactor?
Something is clearly out of whack. Gold has failed to push higher against the backdrop of a lower U.S. dollar for the first time in over a decade and, with pressure on the dollar increasing, the failure of support could ignite a massive decline. Is gold preparing to launch this time? Read More »
5. Stock Market Will Collapse In May Followed By Major Spike in Gold & Silver Prices! Here’s Why
The unintended consequences of five years of QE are coming home to roost! In May or early June the stock market parabola will collapse…followed by a massive inflationary spike in commodity prices – particularly gold & silver – that will collapse the global economy. Read More »
 munKNEE.com Your Key to Making Money


Do know that gold buyers operate in a self-regulated industry, making it important for customers to understand how transactions work. Here are a few for consumers interested in selling gold, diamond, silver to us or another dealer/buyer.
http://www.goldbuyersfayettevillenc.com