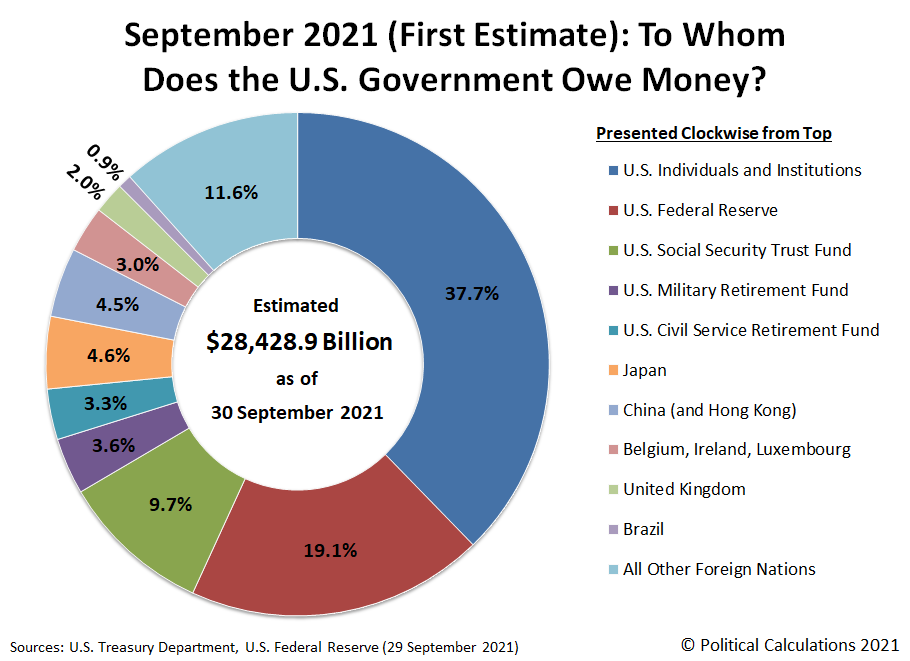
…The following chart indicates…[the extent, in percentage terms, to which various] entities have loaned money to the U.S. government…[and, as such,] their share of the U.S. national debt as of 30 September 2021.
This post by Lorimer Wilson, Managing Editor of munKNEE.com, is an edited ([ ]) and abridged (…) version of an article by Ironman for the sake of clarity and length to ensure a fast and easy read.
(Click on image to enlarge)
(The values for foreign nations shown on the chart represent a first estimate because the U.S. Treasury Department’s data for the amount of U.S. government-issued debt held by foreign entities only reflects its estimates through August 2021. Data through September 2021 will become available next month, which will be subject to revision before being finalized sometime in 2022.)
Once again, the U.S. Federal Reserve is Uncle Sam’s largest single entity creditor, outranking its former top creditor, Social Security’s Old Age and Survivors Insurance Trust Fund, by a widening margin. That margin is widening because Social Security is running in the red, which means it has to cash in its holdings of U.S. Treasuries to keep paying benefits to Social Security beneficiaries at promised levels.
…What is really remarkable is the extent to which the U.S. Federal Reserve is funding the U.S. government’s spending above and beyond what it collects in taxes that has taken place during Joe Biden’s tenure in office.
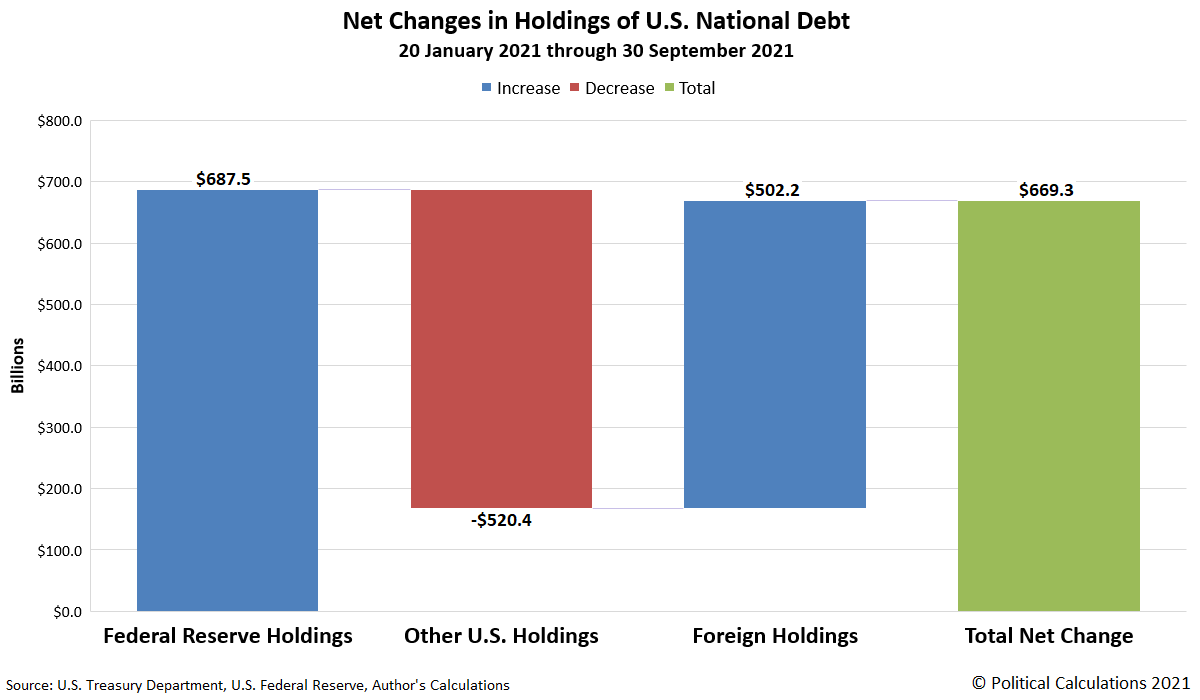
- Since 20 January 2021, the U.S. national debt has increased by $669.3 billion, but the U.S. Federal Reserve’s holdings of U.S. government-issued debt securities has increased by $687.5 billion. That’s possible because the U.S. Federal Reserve has more than offset a net reduction of $520.4 billion in the amount of money other U.S. entities have loaned to the U.S. government during this time.
- At the same time, foreign entities have boosted the amount of money they’ve loaned to the U.S. government by $502.2 billion, which when combined with the other figures, accounts for the overall net change since 20 January 2021.
Below is a visual rundown of the net national debt change math as presented using a waterfall chart:
(Click on image to enlarge)
As of the end of the U.S. government’s 2021 fiscal year, the Federal Reserve had loaned nearly one out of every five dollars the U.S. government owed through the end of September 2021…
A Few Last Words:
- Click the “Like” button at the top of the page if you found this article a worthwhile read as this will help us build a bigger audience.
- Comment below if you want to share your opinion or perspective with other readers and possibly exchange views with them.
- Register to receive our free Market Intelligence Report newsletter (sample here) in the top right hand corner of this page.
- Join us on Facebook to be automatically advised of the latest articles posted and to comment on any of them.
 munKNEE.com Your Key to Making Money


