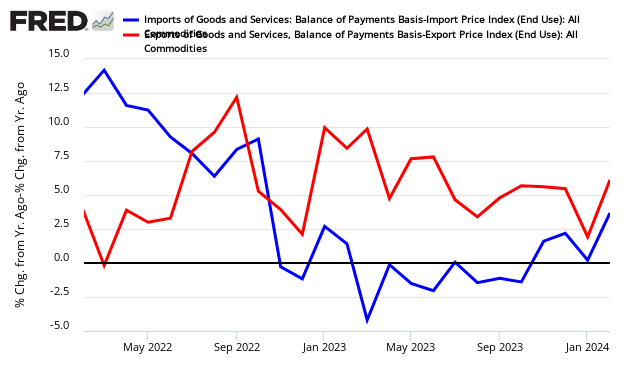
Most of the manufactured goods move between countries in sea containers (except larger rolling items such as automobiles). This pulse point is an early indicator of the health of the economy [so what are they indicating at this point in time – a coming recession or not?]
Imports are a particularly good tool to view the Main Street economy…[as they] overreact to economic changes much like a double ETF making movements easy to see and the December year-over-year import container counts were significantly stronger than last month….
Contracting imports historically is a recession marker, as consumers and businesses start to hunker down:
- Main Street and Wall Street are not necessarily in phase and imports can reflect the direction for Main Street when Wall Street may be saying something different.
- During some recessions, consumers and businesses hunkered down before the Wall Street recession hit – and in the 2007 recession, the contraction began 10 months into the recession.

For this month the three month rolling averages significantly improved for imports and significantly declined for exports:
| Acceleration Month-over-Month | Change from One Year Ago | Year to Date vs. Previous Year | Acceleration 3 Month Rolling Average | 3 Month Rolling Average vs. Average One Year Ago | |
| Imports | +20.9 % | +15.1 % | +4.5 % | +4.3% | +8.9 % |
| Exports | +1.5 % | -10.0 % | +1.8 % | -5.2 % | -4.6 % |
- (The data set [used above] is based on the Ports of LA and Long Beach which account for approximately 40% of the container movement into and out of the United States – and these two ports report their data significantly earlier than other USA ports.
- Econintersect determines the month-over-month change by subtracting the current month’s year-over-year change from the previous month’s year-over-year change. This is the best of the bad options available to determine month-over-month trends – as the preferred methodology would be to use multi-year data – but the New Normal effects and the Great Recession distort historical data).
As the data is very noisy, [however,] the best way to look at this data normally is the 3-month rolling averages. There is a direct linkage between imports and USA economic activity – and the change in growth in imports foretells a real change in economic growth. Export growth is an indicator of competitiveness and global economic growth.
There is a reasonable correlation between the container counts and the US Census trade data also being analyzed by Econintersect but trade data lags several months after the more timely container counts.
[but it should be noted that:]- containers are a relatively new technology and had a 14 year continuous growth streak from 1993 to 2006,
- there is not enough history to make any associations with economic growth – and we must assume a correlation exists.
- Furthermore, it is impossible from this data to understand commodity or goods breakdown (e.g. what is the contents in the containers).
- Any expansion or contraction cannot be analyzed to understand causation.)
…Containers come in many sizes so a uniform method involves expressing the volume of containers in TEU, the volume of a standard 20 foot long sea container. Thus a standard 40-foot container would be 2 TEU.
There is a good correlation between container counts and trade data (the US Census trade data is shown on the graph below). Using container counts gives a two month advance window on trade data.
Inflation Adjusted Year-over-Year Change Imports (blue line) and Exports (red line)

Transport sector rate of growth, in general, is mixed with truck transport slowing and container counts mixed.
The above summary* of the original article has been edited ([ ]), restructured and abridged (…) by Lorimer Wilson, editor of munKNEE.com, for a 18% faster – and much easier – read. (Please note that the previous sentence must be included in any article re-posting to avoid copyright infringement.)
Scroll to very bottom of page & add your comments on this article. We want to share what you have to say!
For the latest – and most informative – financial articles sign up (in the top right corner) for your FREE bi-weekly Market Intelligence Report newsletter (see sample here)
*The author’s views and conclusions are unaltered and no personal comments have been included to maintain the integrity of the original article. Furthermore, the views, conclusions and any recommendations offered in this article are not to be construed as an endorsement of such by the editor.
 munKNEE.com Your Key to Making Money

