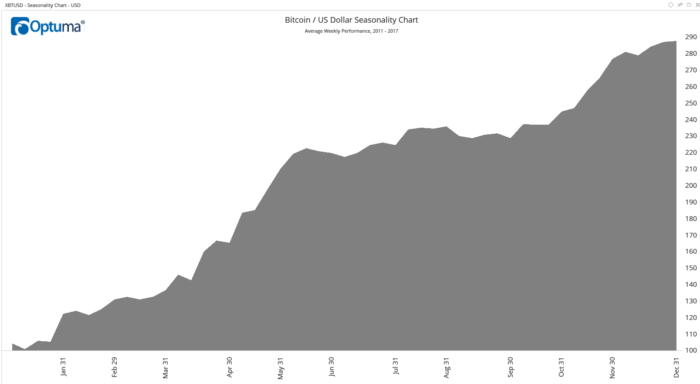
We can expect bitcoin to begin to trade along other typical stock market patterns, like seasonality, next year, and this chart will be one I use to time any investments into it.
 The original article by Chad Shoop has been edited for length (…) and clarity ([ ]) by munKNEE.com to provide a fast & easy read. For all the latest – and best – financial articles sign up (in the top right corner) for your free bi-weekly Market Intelligence Report newsletter (see sample here) or visit our Facebook page.
Last Sunday, Bitcoin, the leading cryptocurrency, gained recognition after the Chicago Board Options Exchange (CBOE) added bitcoin futures contracts for investors to trade it under the symbol XBT and a larger futures market, the Chicago Mercantile Exchange (CME), plans to launch its own bitcoin futures this weekend.
Everyone is talking about it. The buzz around the office this week was moving well beyond typical water cooler talk…
Now that bitcoin is a tradable asset…let’s look at a key characteristic of the currency. When I pull it up in a seasonal trend, a familiar pattern stands out. Take a look:

You can see how bitcoin:
- has a strong rally from the end of January through May.
- Then, it experiences a similar “sell in May and go away” phenomenon that the broader markets exhibit, as it flatlines until November,
- and then we have an end-of-the-year rally.
The above chart will be the one that I use to time any investments into it.
Related Articles from the munKNEE Vault:
1. Bitcoin: Plan Your Exit Strategy NOW – Don’t Wait Until the Stampede Starts
The above are the questions you need to be asking now, during the euphoria stage of a bull market. I’m not calling the top in bitcoin. I’m saying prepare for the top.
2. Bitcoin Price Of $32,500 On January 1, 2018 Possible – Here’s Why
The initial target of $24,340 on December 13 is realistic, considering the parabolic nature of the larger uptrend. With a sustained uptrend, the next target of $32,500 is on January 1, 2018. That upper price level is highly ambitious, yet not out of the question.
3. Bitcoin Could Reach $40,000 By the End of 2018 & Ethereum Could Go To $1,500!
Below is a asset bubble chart showing that bitcoin is now the biggest bubble in history, having surpassed the Tulip Mania of 1634-1637.
4. Bitcoin: Total Wipeout Alert
The pattern on the Bitcoin charts has all the hallmarks of a final terminal blow off that will be followed by a catastrophic wipeout and probably soon…The inexperienced get rich quick merchants who have been flocking in droves to Bitcoin in recent weeks will be vaporized.
5. Bitcoin: Answers To 7 Questions You Were Too Embarrassed To Ask
While almost everyone has heard of Bitcoin at this point, many people are fuzzy on the details: what is a bitcoin, exactly? How do I buy some? What would I use it for? Here are the answers to those and a few other questions you were afraid to ask.
6. Here Are All The Ways You Can Buy, Trade, and Invest In Bitcoin
…Trading bitcoin may still not be as simple as trading most stocks, but it has made huge strides toward becoming a mainstream investment in 2017. Here’s a look at all the ways traders can play bitcoin and what may be coming next.
7. Bitcoin Gives Gold the Finger!
Those who love gold must feel horribly betrayed, particularly as they look at Bitcoin. The same money put into cryptos instead of gold would have yielded millions, if not billions (given enough starting capital) in profits, whereas gold has just withered away like a maple leaf on an autumnal sidewalk. It’s no different for the miners, of course.
8. Bitcoin Could Make Things Worse For Gold Before They Get Better
Bitcoin trading is totally bonkers and it doesn’t look like it’s going to calm down anytime soon. It’s morphed from an underground tech-geek trade to the biggest market mania we’ve seen in decades.
9. The Bitcoin Bubble Explained in 4 Charts
Many financial pundits and crypto advocates have scrambled to argue whether Bitcoin is a bubble or not so, as the financial community takes sides, I have dug into Bitcoin’s tremendous run using nothing but hard data to see whether it’s in bubble territory or not. Below is what I found as illustrated in 4 charts
 munKNEE.com Your Key to Making Money