Automatically receive the internet’s most informative articles bi-weekly via our free bi-weekly Market Intelligence Report newsletter (sample here). Register in the top right hand corner of this page.
Global equities are entering into a new cyclical bull market [according to the following]….charts and indicators.
1. Percentage of Countries in a “Bull Market”
The red line in the graph below shows the proportion of the 70 countries that we track whose main equity benchmark is up at least 20% vs. its lowest point of the past year. As of the time of writing, 74% of (or 52 out of 70) countries are now in a new bull market.
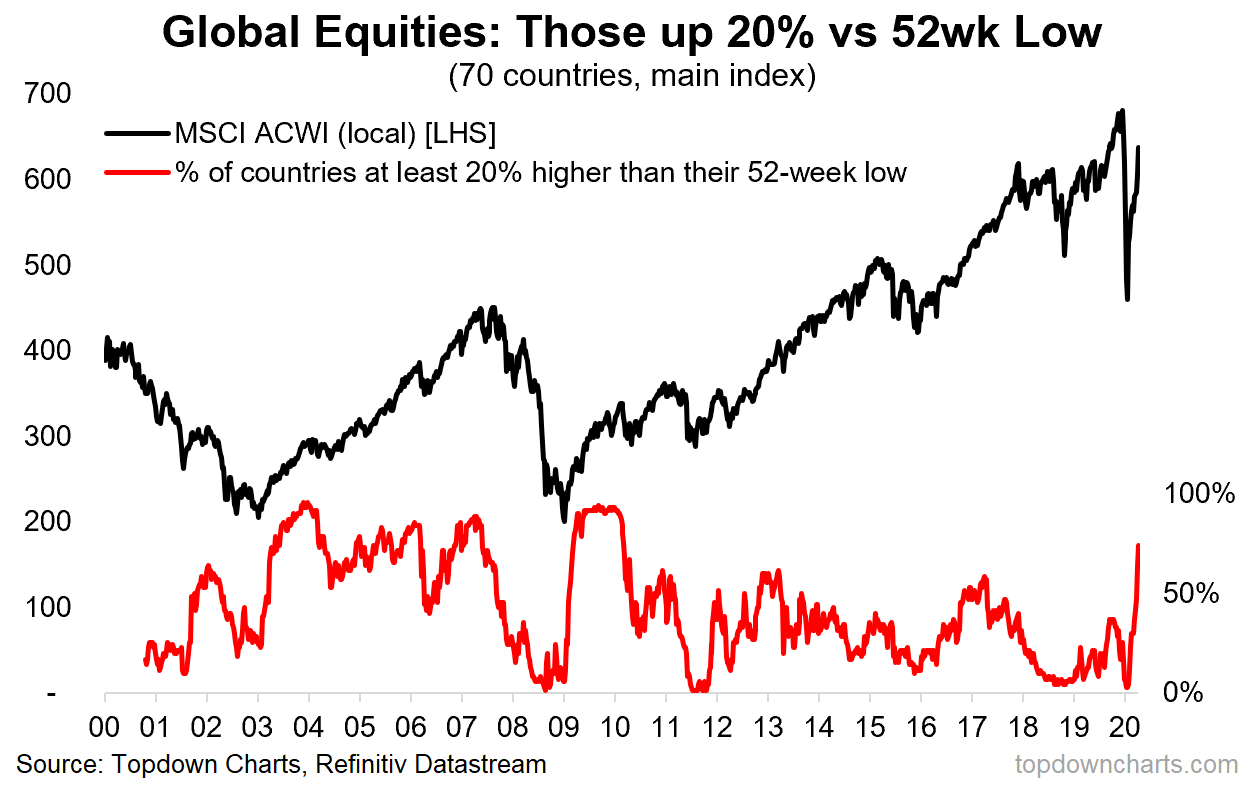
Looking at the history of the above indicator over the past couple of decades: when it turns up like this – typically it means good things for the medium-term outlook for markets.
2. Global Equities – Medium-Term Market Timing Signal
The red line in the chart below again tracks the same 70 countries, but this time is presenting the percentage of countries whose main equity benchmark is positive on a year-over-year percentage basis (or simply is higher now vs. this time last year).
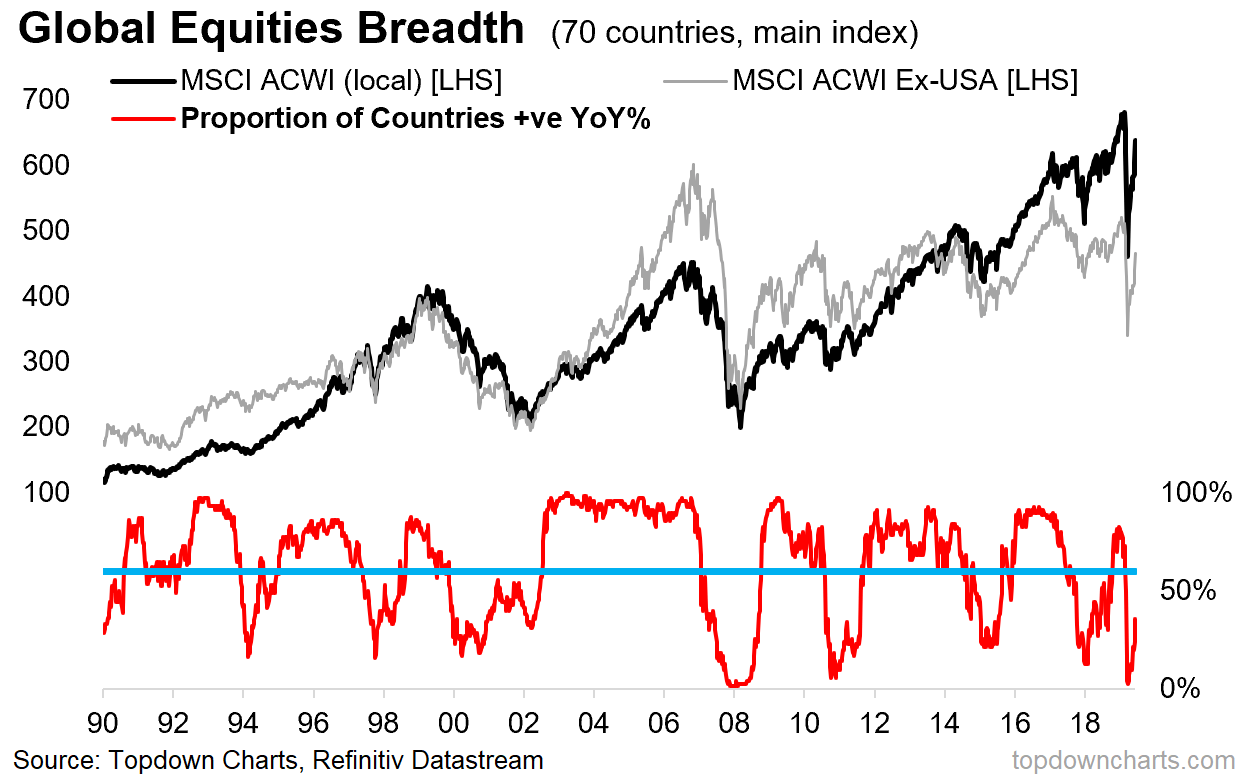
From a bullish/buy-signal perspective, there are 3 signals to note:
- when the indicator collapses to washed-out levels (~20% and below);
- when it does that and then turns up (like now);
- when it passes above 60%
The first two signals are checked off now. In terms of those signals, it’s basically also a rank order of certainty: with the first signal you run the risk of getting in too early; with the last signal you tend to get less “false positives,” but also you miss the meaty first part of the move (e.g. the MSCI All Countries World Index is up 38% off the March 23 low, at the time of writing). Option #2 provides a good compromise between going too early and waiting too long. For reference, that signal first lit-up in early May.
While there are a couple of notable exceptions for the efficacy of option #2 (e.g. 2001), it otherwise has a solid track record for producing profitable medium-term buying signals for global equities…
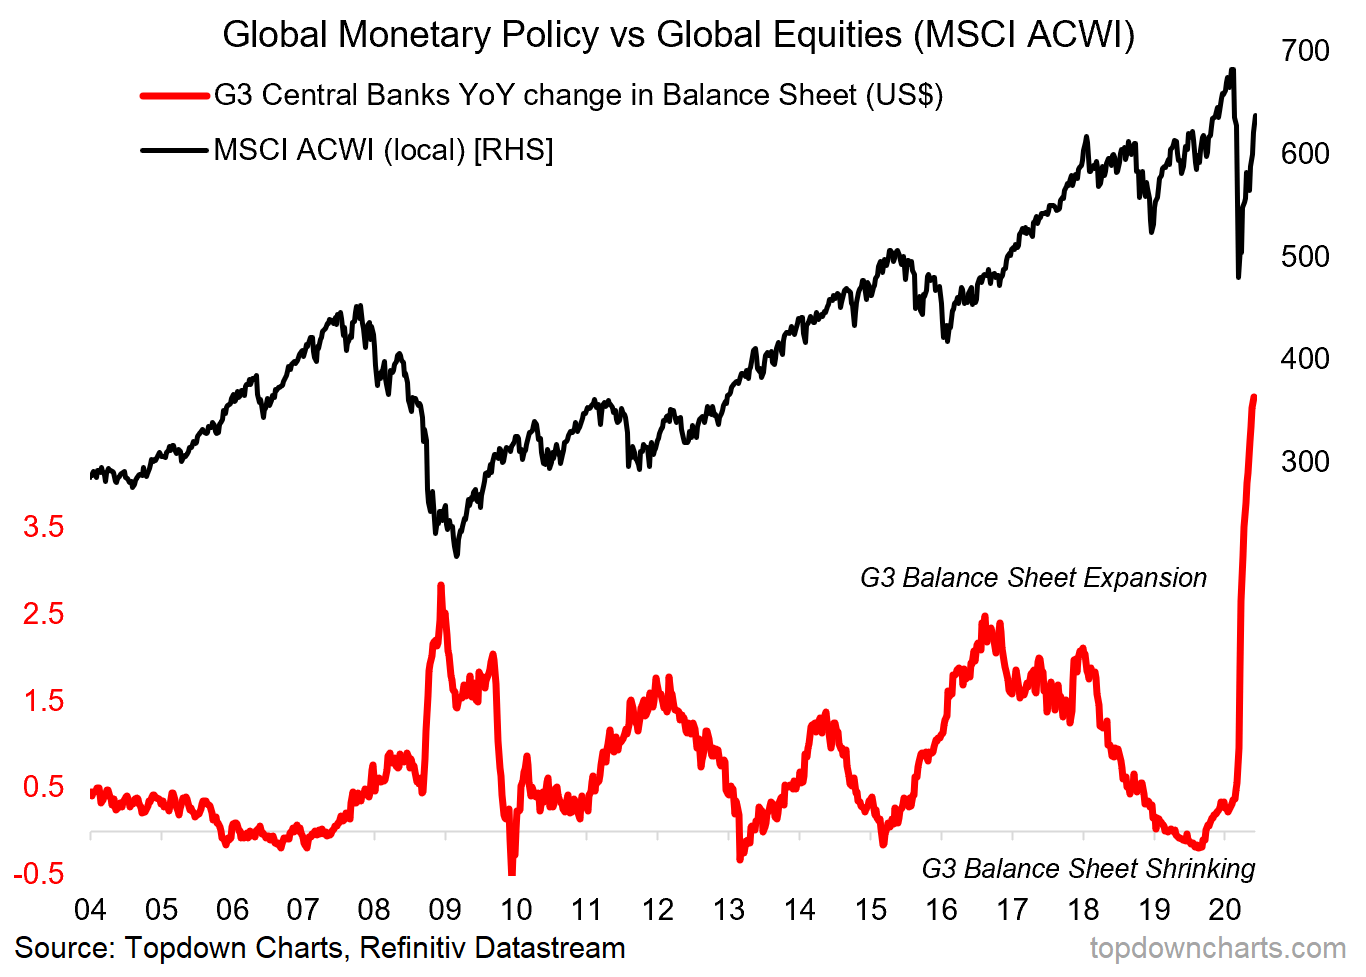
3. Global Central Bank Stimulus Tailwinds
…The monetary policy response…[to thie COVID-19 pandemic has been swift + coordinated globally + coordinated with fiscal policy + targeted at the unique cash flow/liquidity challenges of this crisis + a mix of traditional and non-traditional policy tools. In short, the speed, coordination, and magnitude of the policy response has been absolutely historic.
The chart [below shows]…that G3 central bank balance sheets went from contracting at a pace of -US$200B in September last year to expanding at a pace of +US$5T now. To labor the point: stimulative macroeconomic policy settings tend to be good for risk assets.
Bottom Line
With historic stimulus tailwinds and a series of bullish medium-term technical signals, it looks as though a new cyclical bull market is getting underway in global equities.
Editor’s Note: The original article by Topdown Charts has been edited ([ ]) and abridged (…) above for the sake of clarity and brevity to ensure a fast and easy read. The author’s views and conclusions are unaltered and no personal comments have been included to maintain the integrity of the original article. Furthermore, the views, conclusions and any recommendations offered in this article are not to be construed as an endorsement of such by the editor. Also note that this complete paragraph must be included in any re-posting to avoid copyright infringement.
A Few Last Words:
- Click the “Like” button at the top of the page if you found this article a worthwhile read as this will help us build a bigger audience.
- Comment below if you want to share your opinion or perspective with other readers and possibly exchange views with them.
- Register to receive our free Market Intelligence Report newsletter (sample here) in the top right hand corner of this page.
- Join us on Facebook to be automatically advised of the latest articles posted and to comment on any of them.