…Stocks typically rise going forward from this time of year and it is typically referred to as the year-end rally. in this time period. This article presents, and answers, a number of questions related to that effect, namely: a) How often does such a rally take place? b) How strong is such a rally? and, c) when is the best time for investors to enter the market?
S&P 500 Index, seasonal pattern since 1950
The first illustration below depicts a seasonal chart of the S&P 500 Index. The chart was created by calculating the average returns of all years since 1950 and thus shows the typical seasonal pattern of the S&P 500 Index in the course of a calendar year. The horizontal axis denotes the time of the year, the vertical axis the level of the seasonal index.

Source: Seasonax
The arrows mark the year-end rally between 26 October and 03 January of the next year. In this time span of just over two months, the S&P 500 Index rose on average by 4.27% and, on an annualized basis, this is equivalent to a gain of 24.79%! By way of comparison: in the remainder of the year the S&P 500 Index generated an average annualized gain of a mere 3.58%. That shows you how superior the year-end rally is.
A Very High Win Rate of 82.61 Percent!
The seasonally favorable time period between 26 October and 03 January delivered positive returns in 57 out of 69 cases or 82.61% of the years under review. This is quite high….
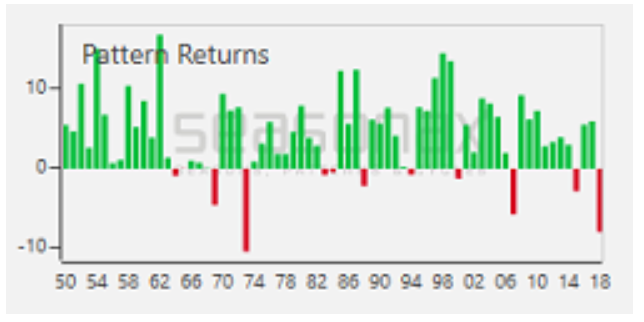
S&P 500 Index, percentage return achieved between 26 October and 03 January in individual years since 1950
The bar chart below shows the return of the S&P 500 Index between 26 October and 03 January in every year since 1950. Green bars denote years in which a positive return was generated, red bars years in which losses were recorded.
Source:Seasonax
As you can see, the green bars denoting positive returns clearly predominate although there were also a few years in which the S&P 500 Index declined during this time period. One of these declines occurred last year, as indicated by the last red bar on the chart.
Conclusion
There is no stock market rule that always works but the high win rate and the well above average gain are evidence that the year-end rally is a particularly favorable seasonal pattern.
I I bought stocks in gold in August. Do you suggest after Christmas I take some out and buy Coins? Also if Trump wins next Nov.the market will surge upward. Should I hang in there until next November?