Many events moved the market this month which are all very bullish for gold. In addition, gold’s leading indicator is currently at a major low area all of which strongly reinforce the likelihood of an upcoming sustained rise. Let us explain.
So say Mary Anne & Pamela Aden (adenforecast.com) in edited excerpts from their original article* entitled As Good As It Gets…For a Buy.
[The following is presented by Lorimer Wilson, editor of www.munKNEE.com and the FREE Market Intelligence Report newsletter (sample here). The excerpts may have been edited ([ ]), abridged (…) and/or reformatted (some sub-titles and bold/italics emphases) for the sake of clarity and brevity to ensure a fast and easy read. This paragraph must be included in any article re-posting to avoid copyright infringement.]
The Aden sisters go on to say in further edited excerpts:
Many events moved the market this month:
- Gold demand was stable [which is a positive for gold].
- Gold is getting a boost from the weaker U.S. dollar…and, since gold and the U.S. dollar generally move in opposite directions, this is very bullish for gold.
- The Fed’s QE stimulus is currently expected to continue well into 2014 which is very bullish for gold.
- Every time Congress raises the U.S. debt ceiling, as it has just done, gold tends to rise. [Growth In National Debt Is 86% Correlated to the Price of Gold! Got Gold?]
Comparing Gold’s Current Rise to the 1970s
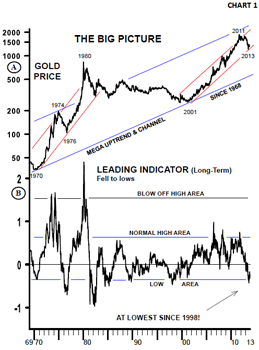
[That being said,] while gold has been much stronger than most currencies over the past 12 years, it still hasn’t compared to the grand rise in the 1970s. As the chart below shows, gold rose 2300% in 10 years, from 1970 to 1980. The blow-off peaks were clearly pronounced. This time around, the gold rise has been moderate in comparison. Gold had a steady 10 year rise from 2001 to 2011 and it gained 661%. That wasn’t shabby by any means, but it certainly wasn’t like the 1970s.
(Click on images to enlarge)
[Neither is] gold’s leading indicator [which only] reached a normal high area during the 2001-2011 rise [compared to] the still to come blow-off high areas seen in the 1970s…In addition, gold’s leading indicator is currently at a major low area. In other words, gold is bombed out and very oversold, reinforcing the likelihood of an upcoming sustained rise.
For now though, we’ll take gold’s renewed move up one step at a time. Much will tell us the direction over the next month or two. We’re currently in a seasonally strong month for the metals and a rise, even if it’s not a strong leg upward, should continue to be promising.
TIMING IS KEY
This is where gold timing comes in.
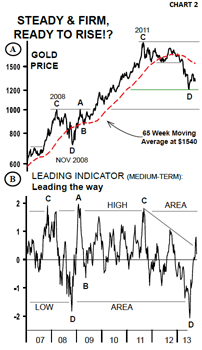
[As can be seen in the chart below] gold has been forming a good looking base since reaching its closing low above $1200 on June 27 and it’s becoming more important for this low area to hold. As long as it does, the market will be fine.
The chart above shows the major steps in the market. The green line shows the $1200 low and, if it holds as most indicators suggest, we could next see gold rise to the $1536 – $1540 area. This is a key level. It’s the old support and the 65-week moving average.
Conclusion
If gold fails to break above $1536 – $1540 the bear will not be out of the woods BUT if it’s clearly surpassed, we could then see the $1700 level tested and possibly the old highs revisited!
[Editor’s Note: The author’s views and conclusions in the above article are unaltered and no personal comments have been included to maintain the integrity of the original post. Furthermore, the views, conclusions and any recommendations offered in this article are not to be construed as an endorsement of such by the editor.]
*http://www.321gold.com/editorials/aden/aden103013.html
Related Articles:
1. Expect Gold to (Only) Drop to $1,150 by Mid-2014! Here’s Why
We are now starting the hyperinflationary phase in the USA and many other countries – and this will all start in 2014. What will be the trigger? The answer is simple – the fall of the U.S. dollar. Read More »
4. Growth In National Debt Is 86% Correlated to the Price of Gold! Got Gold?
The correlation between the gold price, silver price and the debt growth has been amazingly accurate since 2001. Government spends too much money to perform a few essential services and to buy votes, wars, and welfare, and thereby increases its debt almost every year, while gold and silver prices, on average, match the increases in accumulated national debt. Read More »
 munKNEE.com Your Key to Making Money


