Too often investors…focus on the negative, lose confidence in stocks and, as a result, they can miss great bull markets… I believe when it comes to finding investment opportunities…it’s all about both monetary and fiscal policy….[As such,] I encouraged investors to follow the money. With that in mind, here are two of my favorite charts that I believe demonstrate how investors can do exactly that.
So says Frank Holmes (usfunds.com) in edited excerpts from his original article* entitled Two Charts Illustrate How to “Follow the Money”.
[The following article is presented by Lorimer Wilson, editor of www.munKNEE.com and the FREE Market Intelligence Report newsletter (sample here) and may have been edited ([ ]), abridged (…) and/or reformatted (some sub-titles and bold/italics emphases) for the sake of clarity and brevity to ensure a fast and easy read. This paragraph must be included in any article re-posting to avoid copyright infringement.]
Holmes goes on to say in further edited (and in some places paraphrased) excerpts:
Below are said charts:
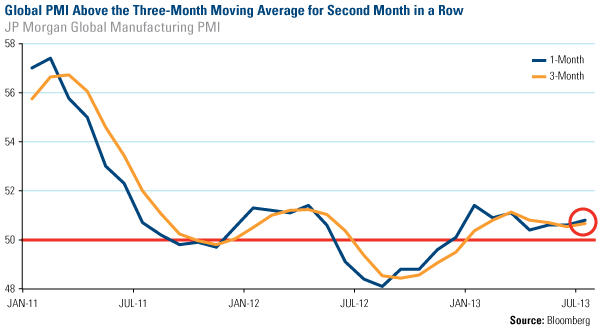
1. Global Manufacturing Activity
Manufacturing data among numerous countries has recently been moving in the right direction. For the month of July, the JP Morgan Global Manufacturing Purchasing Manager’s Index (PMI) stayed above the three-month moving average for the second month in a row. Global output continues to expand, rising to 50.8 from 50.6 in June.
The PMI…[is more than just] a gauge of economic well-being for the manufacturing sector. Last month, after the PMI initially crossed the three-month reading in June, I explained that this “crossover” has historically signaled higher prices for many commodities [stating that,] using the SPDR S&P Metals & Mining ETF (XME) as an example, since the beginning of 2009, history suggests that one month after the crossover, 60% of the time, the XME has gained an average of 7.4%. Consistent with its historical pattern, in July, the XME rose 7.6%.
There may still be room for these stocks to grow, too, as the next two months look promising for metals and mining companies. If you look at the three-month average after the “crossover,” 80% of the time, the XME gained 12.6%.
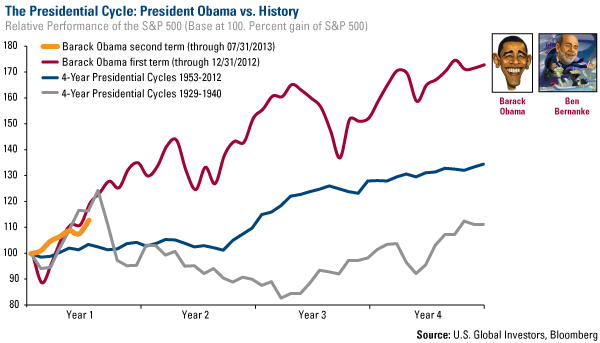
2. Presidential Election Cycle
Last fall, I said that all the excess money in the system, compliments of the Federal Reserve’s policy decisions, helped the S&P 500 Index to climb significantly. In fact, President Barack Obama’s first-term presidential cycle beat the average of all other presidential cycles going back to 1929. You can visually see this substantial growth in the red line below.
Now, a few months into his second term, Obama’s presidential cycle remains remarkable, as stocks continue to climb a wall of worry. The yellow line shows this upward trend, an outcome of the continued easing policies in the U.S.
At U.S. Global, we believe that government policy is a precursor to change, and the change appeared to be significantly positive for the S&P 500. To me, this chart indicates that many investors who have been following the Fed’s quantitative easing trail have found a very profitable path in U.S. stocks.
Looking Forward: Positive with a Chance of Rally?**
The S&P 500 Index closed the month of July with a 4.9% gain. What does this increase mean for the next few weeks and following three months? Research suggests markets continue to rally.
Since 2009, there were 13 individual months the S&P 500 gained at least 4%. Around 85% of the time, the index showed further gains, averaging 2.3% and 5.4%, respectively, for the one-month and three-month time periods.
| Dates: S&P 500 +4% Or More In 1 Month | 1 Month Change | What Happens In Following Month | What Happens In Following 3 Months |
|---|---|---|---|
| Source: Bloomberg | |||
| July 2013 | 4.9% | — | — |
| January 2013 | 5.0% | 1.1% | 6.6% |
| February 2012 | 4.1% | 3.1% | -4.1% |
| January 2012 | 4.4% | 4.1% | 6.5% |
| October 2011 | 10.8% | -0.5% | 4.7% |
| December 2010 | 6.5% | 2.3% | 5.4% |
| September 2010 | 8.8% | 3.7% | 10.2% |
| July 2010 | 6.9% | -4.7% | 7.4% |
| March 2010 | 5.9% | 1.5% | -11.9% |
| November 2009 | 5.7% | 1.8% | 0.8% |
| July 2009 | 7.4% | 3.4% | 4.9% |
| May 2009 | 5.3% | 0.0% | 11.0% |
| April 2009 | 9.4% | 5.3% | 13.1% |
| March 2009 | 8.5% | 9.4% | 15.2% |
| Post-2008 Probability of Positive Returns | 84.6% | 84.6% | |
| Post-2008 Average | 2.3% | 5.4% | |
| 1928-to-date Probability of Positive Returns | 65.1% | 64.7% | |
| 1928-to-date Average | 0.9% | 2.0% | |
The continued rally holds true even if you look farther back in history. Since 1928, which is the year containing the earliest available data from Bloomberg, there were 215 times when the index gained at least 4% in a month. Even then, about 65% of the time, stocks saw an increase. The 1-month and 3-month returns were 0.9% and 2.0%, respectively.
Conclusion
Analyzing historical market trends can help investors take advantage of market cycles, although keep in mind the past does not predict the future. It’s hard to simply brush off the prospective brightness, however, as jobless claims headed in the right direction and manufacturing data out of China, the U.K. and the U.S. were all better than expected this month.
With a forecast for sunny skies, make sure your portfolio is positioned to shine.
[Editor’s Note: The author’s views and conclusions in the above article are unaltered and no personal comments have been included to maintain the integrity of the original post. Furthermore, the views, conclusions and any recommendations offered in this article are not to be construed as an endorsement of such by the editor.]
*http://www.usfunds.com/investor-resources/frank-talk/two-charts-illustrate-how-to-follow-the-money/ **http://www.usfunds.com/investor-resources/frank-talk/stock-forecast-positive-with-a-chance-of-rally/ (©2013 U.S. Global Investors, Inc. All Rights Reserved)
Related Articles:
1. Stock Market (Dow) Should Reach 20,000 By 2018 – Here’s Why
With the stock market up over 20% since we forecast in July, 2012 that we would see the Dow at 20,000…[by the end of the] decade, our forecast seems less ambitious than back then. US stocks are not overpriced or overleveraged, and remain more attractive than at prior peaks. As such, based on current conditions, we now project that…the Dow will reach 20,000 by late 2018. Read More »
2. Don’t Worry About the Threat of Higher Interest Rates Hurting Stocks – Here’s Why
History clearly shows that stocks don’t fall during periods of rising interest rates. Sure, they might fall a little when a rate hike is announced – maybe for a week or so – but they usually bounce back quickly – and then they go higher. Read More »
3. We Think the Prognosis for Stocks Looks Good – Here’s Why
Stocks have generally performed very well in rising-rate environments but the current rate cycle is unlike any other of the past 40 years, keeping investors on edge. A lot will depend on how inflation behaves. Read More »
4. Current Stock Market High Is NOT a Bearish Signal – Here’s Why
The Dow has begun a major rally 13 times over the past 112 years which equates to an average of one rally every 8.6 years so, as it stands right now, the current Dow rally that began in March 2009 would be classified as well below average in both duration and magnitude. Read More »
5. Correlation of Margin Debt to GDP Suggests Stock Market Has More Room to Run
Are stocks in a bubble? While leverage has returned to the stock market driving up stock prices and aggregate demand in the process, margin debt is still shy of its all-time high as a percentage of GDP, so there is certainly some headroom for further rises. A look at the following 5 charts illustrate that contention quite clearly. Read More »
6. The Stock Market: There’s NOTHING to Be Bearish About – Take a Look
There’s nothing to be bearish about regarding the stock market these days. I’ve reviewed my 9 point “Bear Market Checklist” of indicators and it is a perfect 0-for-9. Not even one indicator on the list is even close to flashing a warning sign so pop a pill and relax. There’s no immediate danger threatening stocks. Read More »
7. Pop a Pill & Relax ! There’s NO Immediate Danger Threatening Stocks
Right now there’s nothing to be bearish about. I say that with conviction, because my “Bear Market Checklist” is a perfect 0-for-9. Heck, not a single indicator on the list is even close to flashing a warning sign. We’ve got nothing but big whiffers! Take a look. Pop a pill and relax. There’s no immediate danger threatening stocks. Read More »
8. Latest Action Suggests Stock Market Beginning a New Long-term Bull Market – Here’s Why
There are several fundamental reasons to believe that this week’s stock market activity, where the S&P 500 has moved more than 4% above the 13-year trading range defined by the 2000 and 2007 highs, could mark the beginning of a long-term bull market and the end of the range-bound trading that has lasted for 13 years. Read More »
9. Sorry Bears – The Facts Show That the U.S. Recovery Is Legit – Here’s Why
Today, I’m dishing on the unbelievable rebound in residential real estate, pesky rumors about the dollar’s demise and a resurgent U.S. stock market. So let’s get to it. Read More »
10. Stocks Are NOT In Another Bubble – Here’s Why
U.S. stocks are off to one of their best starts in years. Most indices are up 10% year to date, prompting many investors to ask: “Are we in another bubble?” The answer is no, at least when it comes to equities. Here are three reasons why:
11. Research Says Stock Market Bull Should Continue Its Run Until…
The mainstream financial press would like us to believe that because the S&P 500 and Dow 30 are at or near their record highs that it must mean we’re nearing the end of the current bull market and, as such, now must be a terrible time to buy stocks. Let’s not jump to any conclusions, though. Instead, let’s do our own due diligence to find out. Hint: If you’ve been stuffing cash under the mattress since the last market crash, you might want to finally go deposit it in your brokerage account. Here’s why… Words: 420
12. These 4 Indicators Say “No Stock Market Correction Coming – Yet”
While I remain cautious on stocks and the risk trade, the technical picture shows that the uptrend to be intact and the bulls should still be given the benefit of the doubt for now. At this point, any call for a correction is at best conjecture [as evidenced by the following 4 indicators]. Words: 399; Charts: 4
The Swimsuit Issue Indicator says that U.S. equity markets perform better in years when an American appears on the cover of Sports Illustrated’s annual issue as opposed to years when a non-American appears on the cover. [What is the nationality of this year’s cover model? Can we expect returns above the norm or will we see a year of underperformance for the S&P 500 this year? Read on.] Words: 323 ; Table: 1
14. Bull Market in Stocks Isn’t About to End Anytime Soon! Here’s Why
As we all know, money printing always leads to inflation. It’s just a matter of figuring out which assets get inflated. This time around gold is not the only beneficiary, stocks are, too, and I’m convinced that the chart below holds the key to the end of the bull market. Words: 475; Charts: 1
15. QE Could Drive S&P 500 UP 25% in 2013 & UP Another 28% in 2014 – Here’s Why
Ever since the Dow broke the 14,000 mark and the S&P broke the 1,500 mark, even in the face of a shrinking GDP print, a lot of investors and commentators have been anxious. Some are proclaiming a rocket ride to the moon as bond money now rotates into stocks….[while] others are ringing the warning bell that this may be the beginning of the end, and a correction is likely coming. I find it a bit surprising, however, that no one is talking of the single largest driver for stocks in the past 4 years – massive monetary base expansion by the Fed. (This article does just that and concludes that the S&P 500 could well see a year end number of 1872 (+25%) and, realistically, another 28% increase in 2014 to 2387 which would represent a 60% increase from today’s level.) Words: 600; Charts: 3
16. 5 Reasons To Be Positive On Equities
For the month of January, U.S. stocks experienced the best month in more than two decades [and the Dow hit 14,009 on Feb. 1st for the first time since 2007]. Per the Stock Traders’ Almanac market indicator, the “January Barometer,” the performance of the S&P 500 Index in the first month of the year dictates where stock prices will head for the year. Let’s hope so…. [This article identifies f more solid reasons why equities should do well in 2013.] Words: 453
17. Start Investing In Equities – Your Future Self May Thank You. Here’s Why
As Winston Churchill once said: “A pessimist sees the difficulty in every opportunity; an optimist sees the opportunity in every difficulty” and in that vain I challenge all readers to fight off the negativity, see long-term opportunity in global equity markets and, most importantly, remain invested. Your future self may thank you. Words: 732; Charts: 6
18. Harry Dent Sees Dow 3,000; Seth Masters Sees Dow 20,000! Who’s Most Likely Right?
Harry Dent, the financial newsletter writer and CEO of economic forecasting firm HS Dent, has one of the most bearish calls on stocks we’ve heard in a while. Appearing on CNBC yesterday, Dent explained the demographics-driven thesis behind his Dow 3000 call. Read More »
19. Dow 20,000 (and 2,000 for the S&P 500) Likely Within 5-10 Years! Here’s Why
A new position paper by Seth J. Masters, chief investment officer of Bernstein Global Wealth Management, entitled “The Case for the 20,000 Dow” is startling. Masters maintains that the odds Dow will rise by more than 7,000 points – an increase of more than 50% – by the end of this decade are excellent. [Below is his argument for such a lofty expectation.] Words: 715 Read More »
20. Why the Dow Could Hit 20,000 by 2014
To move up from the current 12,600 level to 20,000 by the summer of 2014, the Dow would need to rise about 16.5% each year or about 58% in a three-year period and in the past 25 years the Dow has risen by this much on at least 13 occasions. During those times, there was only one period of sustained annual gains, when the Dow rose an average of 26% from 1995 through 1999. The key question: what would it take to justify a three-year, steady, robust gain? It all comes down to corporate profits [and the extent to which] multiple investors are willing to assign [dollars] to these profits. [Let me explain.] Words: 761
21. Dow 20,000: the Latest in Hype, Happy Talk and Irrational Exuberance
Hot headlines about the Dow “storming back soon,” soaring to the “Next Stop, Dow 20,000” is nothing more than a new cycle of irrational exuberance. After losing an inflation-adjusted 20% the last decade, a prediction that the Dow will roar back 80% anytime soon is misleading, pure speculative hype. Reminds me of book titles like “Dow 36,000” and “Dow 100,000” back in 1999 – and memories of those mutual funds selling with absurd multiples over 40, with annual returns in excess of 100%. Worse than the tulip-bulb mania of the 1590s. What’s really roaring back is hype, happy talk and irrational exuberance. Words: 531
22. Could Dow 20,000 be Just Around the Corner?
Most first quarter 2011 earnings reports are in and…over three-quarters exceeded expectations… [with] results showing a desirable combination of growing revenues, profitability and cash flow … [As such,] today’s stock market valuations are conservative compared to typical bull markets accompanied by investor enthusiasm. In the past, using 2011′s estimated earnings, the average P/E ratio could easily be 15 and…that would put the Dow Jones Industrial Average (DJIA) at 15,000 today – about 20% above today’s level. [Were we to] add in high optimism like the kind we’ve seen in other investments recently, a 20 P/E ratio would be possible – and the DJIA would be 20,000 – 60% higher [than it is today! Let’s take a look at the possibility.] Words: 540
23. Jeremy Siegel: 50% Chance of Dow Reaching 17,500 By The End Of 2013! Here’s Why
Last month, Wharton Professor Jeremy Siegel boldly claimed that there was a 70% chance that the DOW could reach 15,000 this year [and that] there’s a 50% chance that it could reach 17,500 by the end of 2013. [Here are his reasons]. Words: 291
 munKNEE.com Your Key to Making Money
 click to enlarge
 click to enlarge


