“Numerous factors are signaling that…higher silver prices are very likely going forward…implying that SLV is likely to outperform many asset classes going forward and, [as such,] is a strong buy right now.”
By Lorimer Wilson, editor of munKNEE.com – Your KEY To Making Money!
[This article of edited excerpts* (1315 words) from the original article (1633 words) by Victor Dergunov provides you with a 37% FASTER – and EASIER – read. Dergunov is receiving compensation from Seeking Alpha for pageviews of his original unedited article as posted there so please refer to it for more detail. Please note: This complete paragraph, and a link back to the original article, must be included in any article re-posting to avoid copyright infringement.]
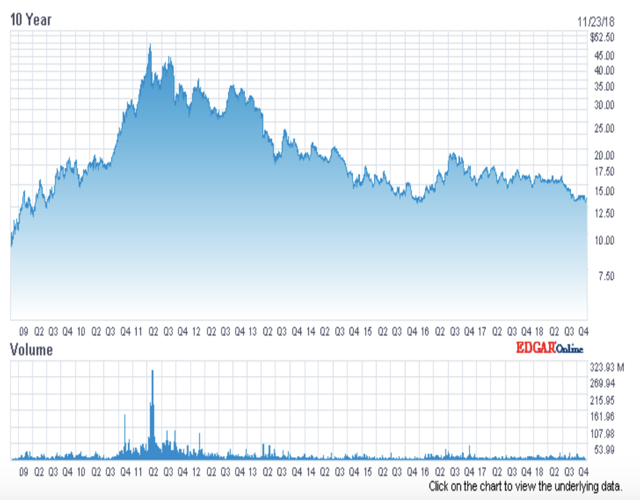
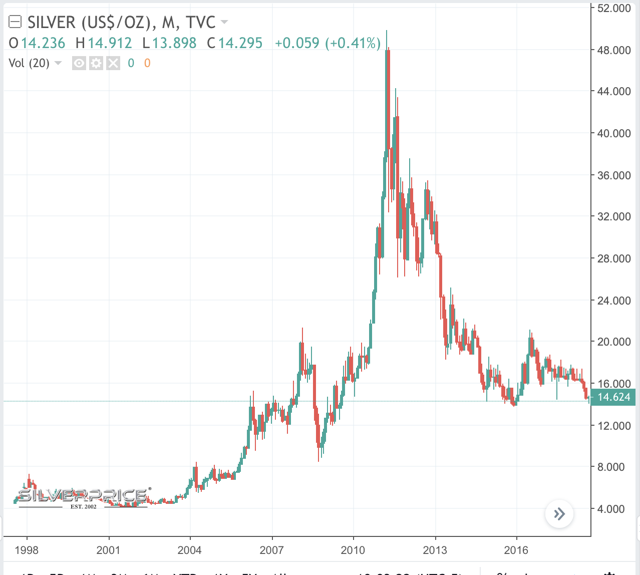
“The Silver/iShares Silver Trust (SLV) has been a disappointing investment in recent years. In fact, since topping out at around $50 an ounce in 2011, silver has cratered by more than 70% and is now trading at some of its lowest levels in the last decade.
SLV 10-Year Chart
Source: Nasdaq.com
About SLV
SLV is:
- an exchange-traded fund that is designed to give investors a cost-efficient way to gain access to the silver market without having to buy silver futures or the physical metal…
- engineered to mimic the spot price of silver. Each share owned by an investor represents a fractional ownership in the fund, which holds over 325 million ounces of physical silver worth roughly $4.7 billion…
- an efficient and convenient trading vehicle, as it mimics silver’s spot price, yet investors do not need to deal with exchanges that facilitate futures contracts, and do not have to pay prices over spot to procure the physical asset…
- extremely liquid and can easily be bought and sold like any other highly liquid stock or ETF.
- In addition, SLV has very attractive options that can be traded with great ease.
Since SLV is physically backed by silver and mimics the commodity’s price almost identically, I will refer to SLV and silver interchangeably throughout this article.
1. Sentiment Amongst Speculators: Incredibly Negative
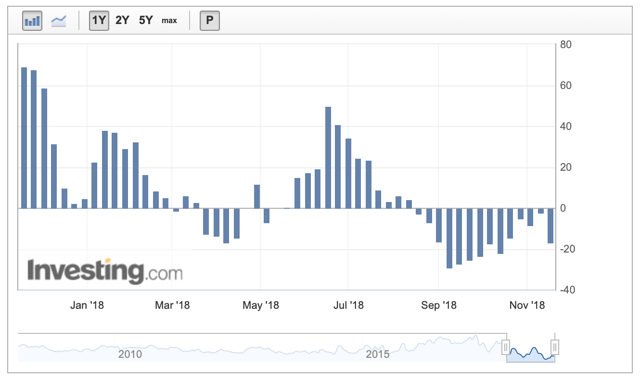
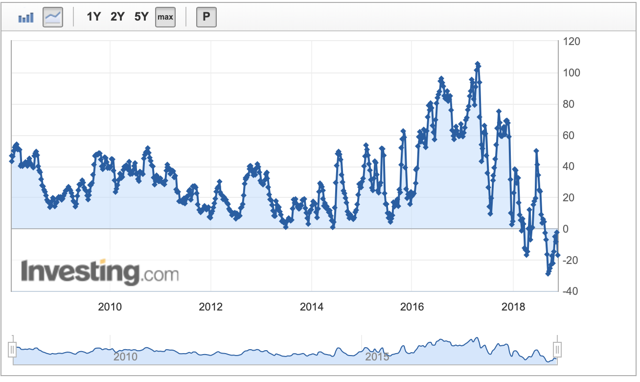
One factor that appears to be a shining counter indicator is the fact that speculators are incredibly bearish in their silver positions right now. In fact, the COT report shows that silver’s net speculative positions have been negative for 14 straight weeks now. This implies that the silver trade has become extraordinarily one-sided.
COT: 1-Year
COT: 10 Years
There is a remarkable amount of pessimism in the silver market, and it is likely to precede a substantial change in sentiment going forward. Just to introduce some context to this image, net speculative positions have not been negative, not even for a month over the last decade until this year. Now, since the start of 2018, net speculative positions have been negative in 20 weeks or nearly half of all the weeks throughout 2018…Just like speculators are typically overly bullish at a top in the market, speculators are normally overly bearish towards the bottom in a market, which is where we appear to be with silver right now.
2. Gold to Silver Ratio: At an Extreme
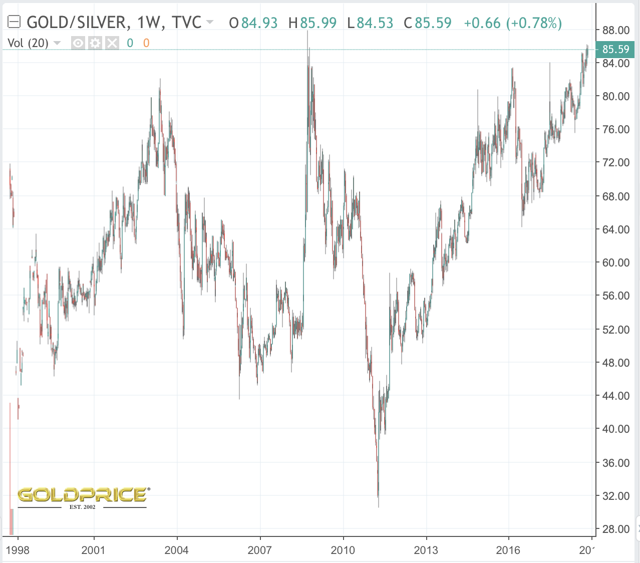
Another time tested historical indicator flashing a clear signal that a long-term bottom is likely in or approaching is the gold to silver ratio. The silver ratio is significant because it indicates how many ounces of silver can be bought with a single ounce of gold. Silver prices lead gold prices to the upside as well as to the downside. Therefore, when a market top occurs in the precious metals market, a relatively low number of silver ounces can be bought with an ounce of gold (35-45). On the flipside, when silver is cheap relative to gold, and you can buy 75-85 ounces of silver with one ounce of gold, a bottom in the precious metals market is likely approaching. Throughout recent history, every time this ratio has gotten skewed heavily, it signaled that a bottom was either in or close to materializing.
- In 2003, when the ratio hit 82, it marked a substantial bottom in silver prices. The price then took off, roughly tripling over the next year.
- Then again in 2008, the ratio hit 87 in the major gold/silver bottom. After that, silver exploded to the upside by about 500%, topping out in 2011 at roughly $50.
- More recently, the ratio hit around 83 in the early 2016 gold and silver bottom, after which silver surged by about 50% in just a few months.
Gold to Silver Ratio: 20 Years
Silver Price: 20 Years
Right now, the ratio is at around 86, one of its highest levels in history, and if history is any guide, it is very likely suggestive of a significant bottom approaching in the precious metals market.
3. Tight Supply and Demand Dynamic
With prices crashing and with sentiment at rock-bottom levels, you would think there is increasing supply in the market, or that perhaps demand for silver is falling off a cliff. However, no such thing appears to be occurring. In fact, the opposite appears to be true.
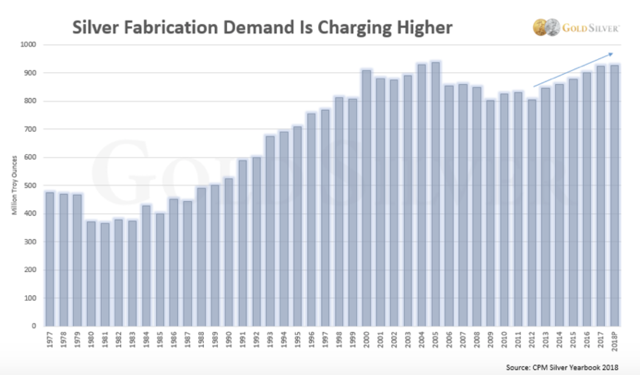
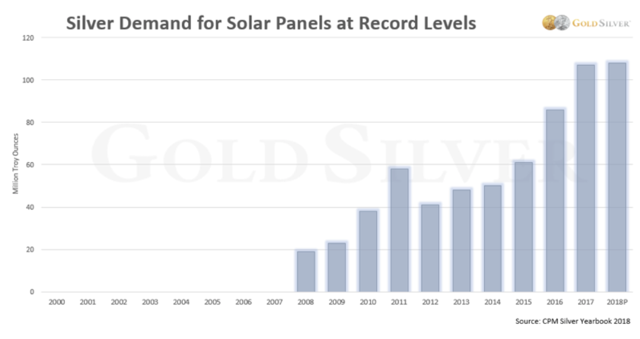
2017’s global silver mine production was well below 2014’s levels, and was roughly on par with 2012’s output. At the same time, ETP demand is near an all-time high, as is silver fabricated demand. Solar demand is at an all-time high and is likely to continue to gain momentum going forward. China’s demand was also at an all-time high in 2017, and is projected to grow this year as well.
Silver Mine Production Output
In general, silver demand appears to be robust across the board, and due to the metal’s wide use in various industries, it is likely to only increase going forward – yet mining output has been largely stagnant for years. In fact, supply has been shrinking in recent years.
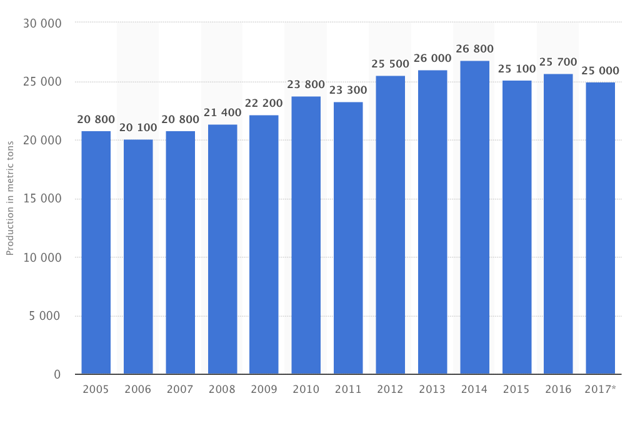 Source: Statista.com
Therefore, the demand supply market forces are extremely tight, and are likely to contribute to silver’s next move higher, possibly in a big way.
4. Inflationary Pressures
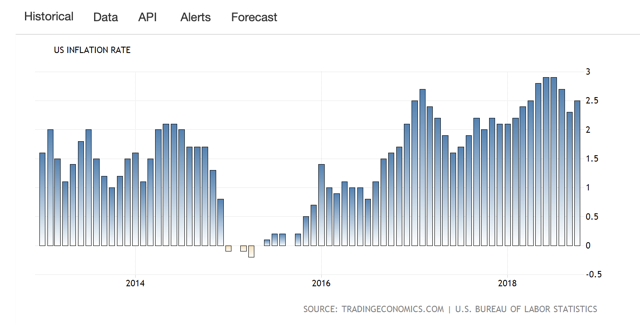
The inflationary picture is heating up, and historically elevated inflation has proved to be extremely supportive to silver prices. There’s no reason to expect that this time will be any different.
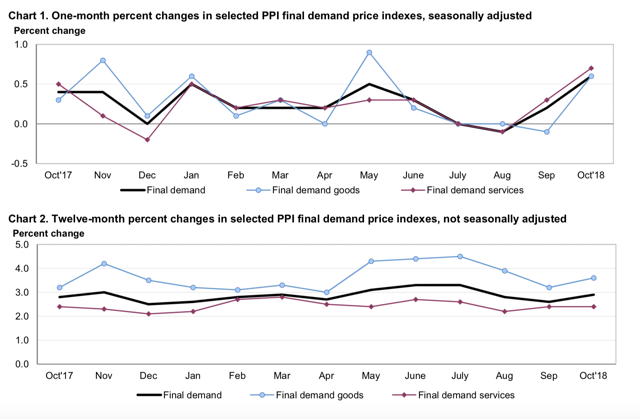
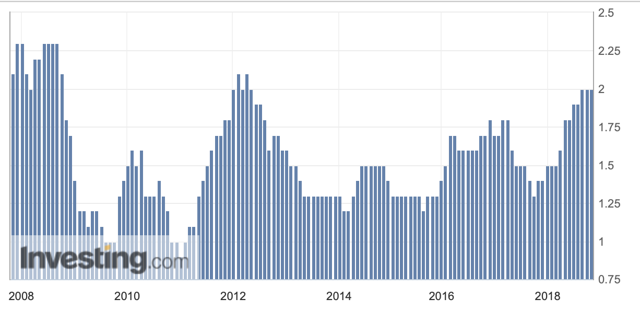
If we look at the CPI, inflation is between 2.5% and 3% and clearly trending higher. The PPI is around 3-4%; final demand goods PPI is trending between 3% and 5% and could be headed substantially higher due to tariffs. Last month’s wage growth came in at 3.7%, one of the highest readings over the past 10 years and even the Fed’s trusted PCE is bumping up against 2% and threatening to go higher.
U.S. Inflation CPI: 5 Years
PPI: Past Year
Source: bls.gov
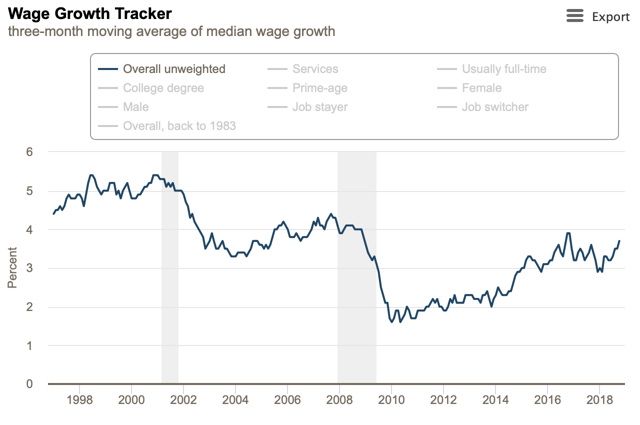 Source: frbatlanta.org
PCE 10-Year
These are some of the highest inflation readings over the past decade, and inflation could potentially go much higher. Also, this is happening while the Fed has tightened rates, relatively aggressively over the past 2 years. What will happen when the Fed is forced to move back from its ultra-tight policy, or is compelled to easy rates going forward?
What Will Happen in The Next Crisis?
…The economy has grown extremely accustomed to ultra-easy credit and zero percent interest rates provided by the Fed…[so,] when a serious downturn does become evident, the Fed will very likely return to juicing the economy with more monetary easing…In this case, the dollar will go much lower, and silver will go substantially higher. We may see a replay of the 2008-2011 500% surge, or possible higher even, depending on the size of the crisis, and its impact on the dollar.
5. Technical View: Long-Term Double Bottom
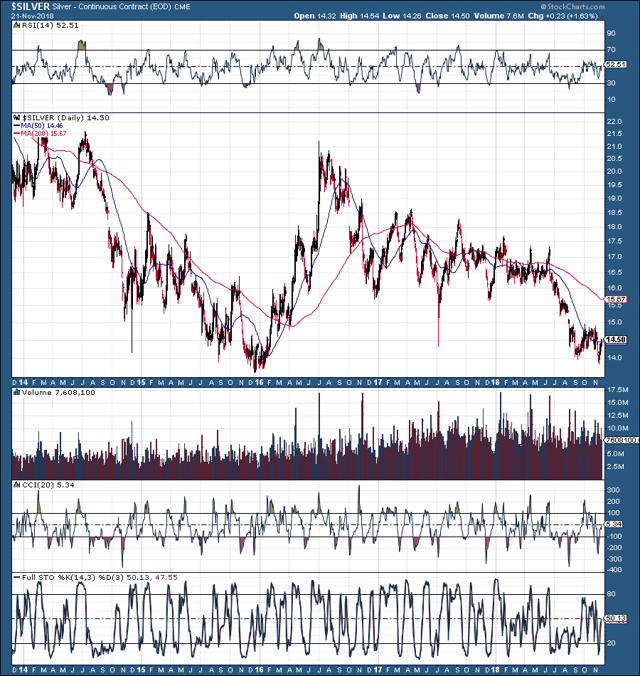
Silver: 5-Year Chart
The above chart…[shows] a long-term double-bottom pattern developing in silver.
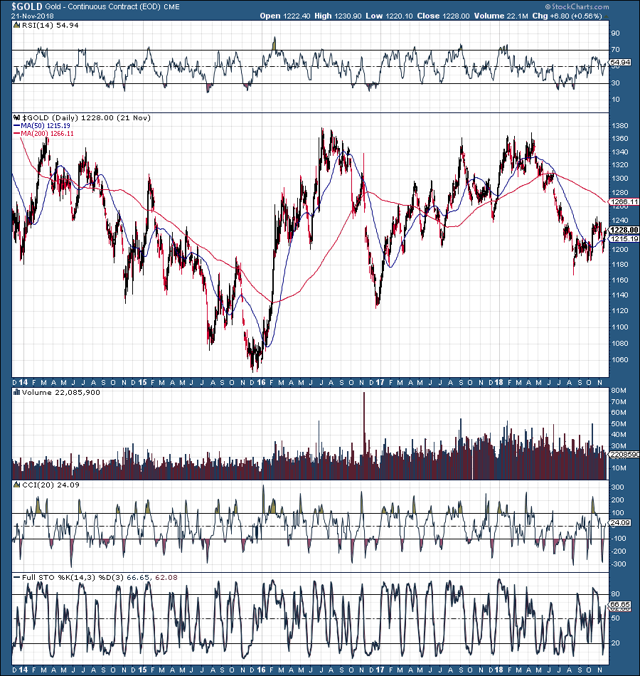
Gold: 5-Year Chart
…[The above chart shows] that gold…is in a clear long-term uptrend…Silver typically follows gold’s trajectory on a long-term basis…[so it] is likely to start to substantially outperform gold as momentum increases.
The Bottom Line
…The [above] underlying factors signal that it may be an ideal time to get invested in silver, and buy SLV for the long term.”
(*The author’s views and conclusions are unaltered and no personal comments have been included to maintain the integrity of the original article. Furthermore, the views, conclusions and any recommendations offered in this article are not to be construed as an endorsement of such by the editor.)
Want your very own financial site? #munKNEE.com is being given away – check it out!
For the latest – and most informative – financial articles sign up (in the top right corner) for your FREE bi-weekly Market Intelligence Report newsletter (see sample here).
Scroll to very bottom of page & add your comments on this article. We want to share what you have to say!
If you enjoyed reading the above article please hit the “Like” button, and if you’d like to be notified of future articles, hit that “Follow” link.
 munKNEE.com Your Key to Making Money
