No matter what the latest “news” development is for PMs that paints a rosy picture, those in the fundamentalist camp are looking through rose-colored glasses to expect change in the near future. The charts continue to tell a more accurate story that belie all known|fundamentals, and the charts shown here depict a market in decline with no apparent end in sight.
The above are edited excerpts from the original article* by Michael Noonan (edgetraderplus.com) entitled Gold And Silver – Charts Tell The Story. Decline Not Over.
[The following is presented by Lorimer Wilson, editor of www.munKNEE.com and the FREE Market Intelligence Report newsletter (sample here). The excerpts may have been edited ([ ]), abridged (…) and/or reformatted (some sub-titles and bold/italics emphases) for the sake of clarity and brevity to ensure a fast and easy read. This paragraph must be included in any article re-posting to avoid copyright infringement.]
Noonan goes on to say in further edited excerpts:
However important underlying fundamentals are, in terms of supply vs. demand, they have been, and continue to be, of little to no use in determining when reality will re-enter the market. When that happens, price will adjust and reflect the true picture of gold and silver’s record (demand) accumulation.
All that matters for now is the political situation involving the moneychangers and their puppet government regimes giving them cover during the end game of their world-wide theft. Just last Thursday, we saw once again another “smash-down” in gold futures. At one of the best possible times to assure liquidity and excellent execution, 1,500 contracts were sold around 5:30 a.m., CST. Who needs to worry about getting good fills when the only objective is to intentionally move the market lower?
Gold – Monthly Chart
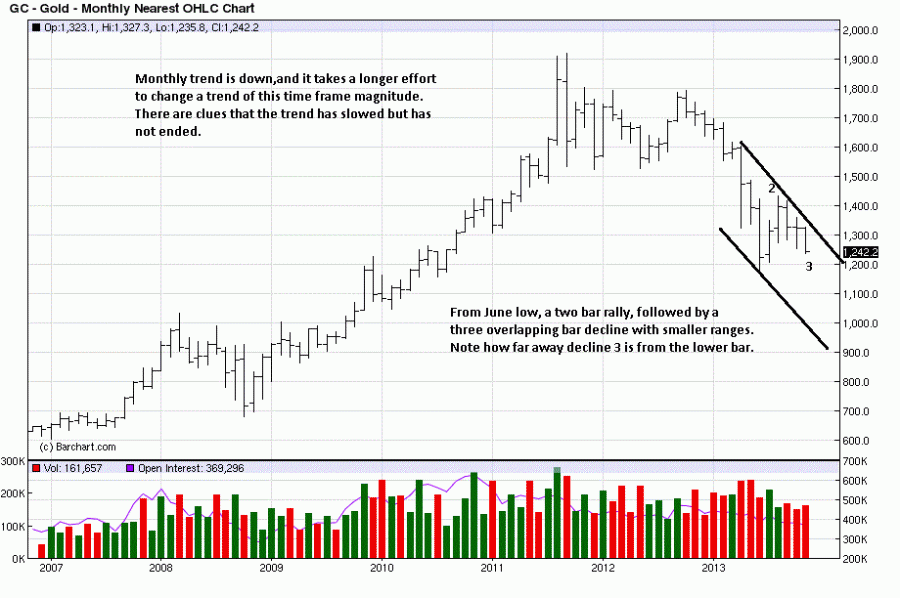
The monthly chart below is presented to show how the last three months have had overlapping bars. This means there is a greater battle between buyers and sellers at a level where sellers should be in total control.
Contrast the last three bars with the two preceding, and the other two rally bars show less overlap, indicating greater EUM, (Ease of Upward Movement). The ranges of the two rally bars are also larger than the last three decline bars which supports the conclusions made.
It takes more time and greater effort to turn a monthly trend than a weekly or a daily one. While there is no evidence of a turn in trend, the fact that price is hugging the upper down channel line is more positive. In a down market, one would expect to see price hugging the lower channel line.
Gold – Weekly Chart
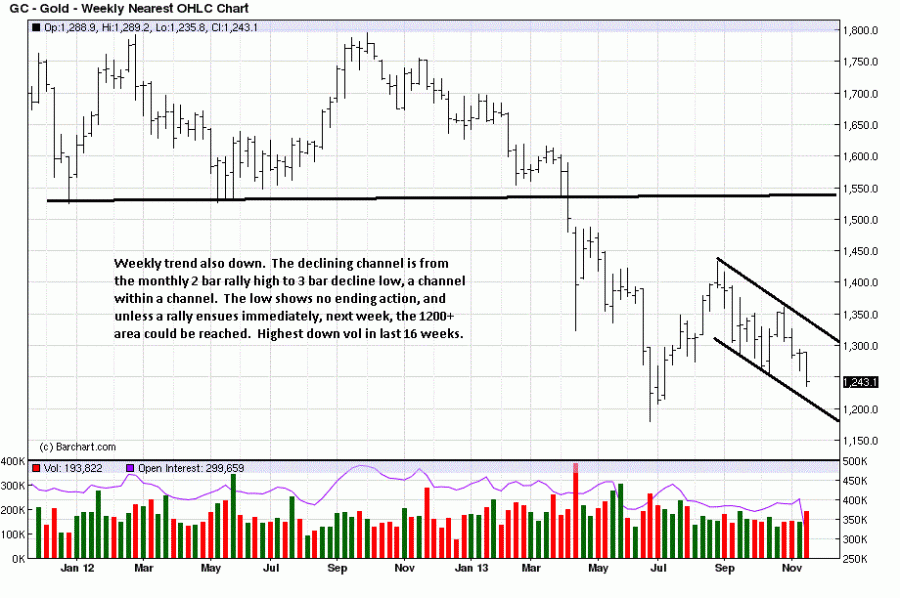
The weekly chart below shows a slightly different picture with price nearer the lower channel line. We can infer price is closer to a potential support area, and volume increased in the process. The significance of the increase in volume is addressed on the daily chart below, and again on the silver weekly/daily charts below.
Gold – Daily Chart
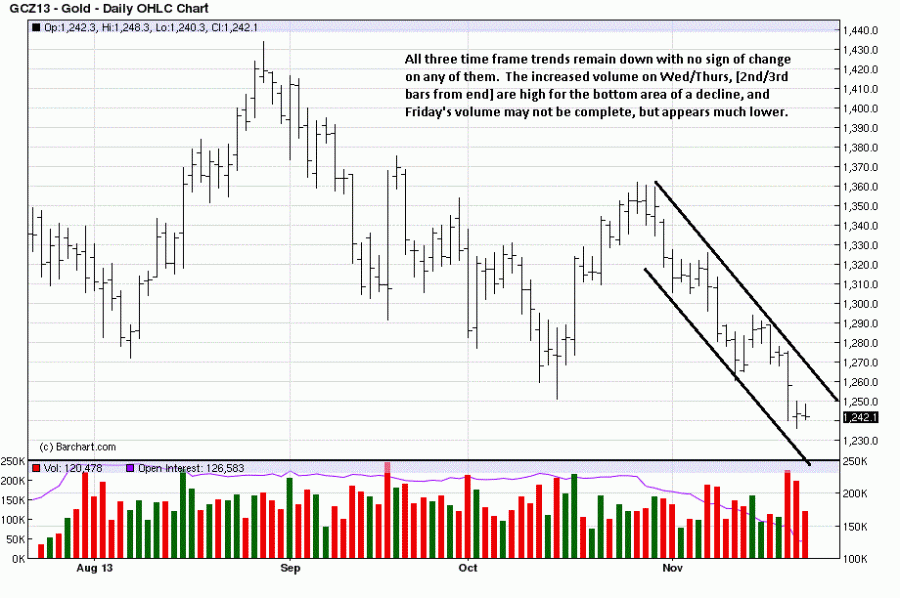
The daily chart below is a more complicated read, yet revealing about that 1,500 contract sale, seen on the third bar from the end with a sharp volume increase. One would expect a big “win” for the bears, with all that unopposed selling, yet the location of the close, mid-range the bar, tells us buyers were equally present, keeping price from closing lower.
It is the…[ last] two trading days that make the read more complicated. [On] Thursday the 2nd bar from the end only went marginally lower than Wednesday’s low and closed higher than the opening. Volume was much higher than average, of late, so buyers were again present, keeping price from extending lower. Friday’s activity is the coin toss.
After two days of showing some presence, buyers could not take advantage and rally price higher. At the same time, sellers could not take advantage of the trend momentum and press price lower. This makes Friday an inside day, and the range was small. From small ranges, a form of market balance, we can expect imbalance to follow. Note the small bar, 4th from the end. It led to a wide-range imbalance sell-off the next day.
The advantage of reading developing market activity, as we are doing, is you do not have to know in advance in which direction price will move. Instead, we assess the situation and prepare accordingly, following the market is it moves directionally.
This analysis is all about the paper futures market, and there is no reason to be on the long side. As to the physical, continued buying is always recommended, especially at these low levels. The reason for buying is to own and hold the physical in opposition to the central banker’s worthless fiat issue, as the most effective means of preservation/protection of one’s capital.
Silver – Monthly Chart
As seen below, the monthly chart on silver is holding better than gold by virtue of the last three bars contained in the range of the 4th bar. Gold’s 4th bar has already been exceeded, downside. The message is one of effort vs. result. The 4th bar shows EUM, and the next three down bars are labored, by comparison.
Price is staying closer to the upper channel line, (resistance), and not reacting away from it and all the activity is occurring at an axis line that acts as support in one area, then becomes resistance, or vice versa, as here. The trend has not ended, but it is showing potential for change as much for continuation.
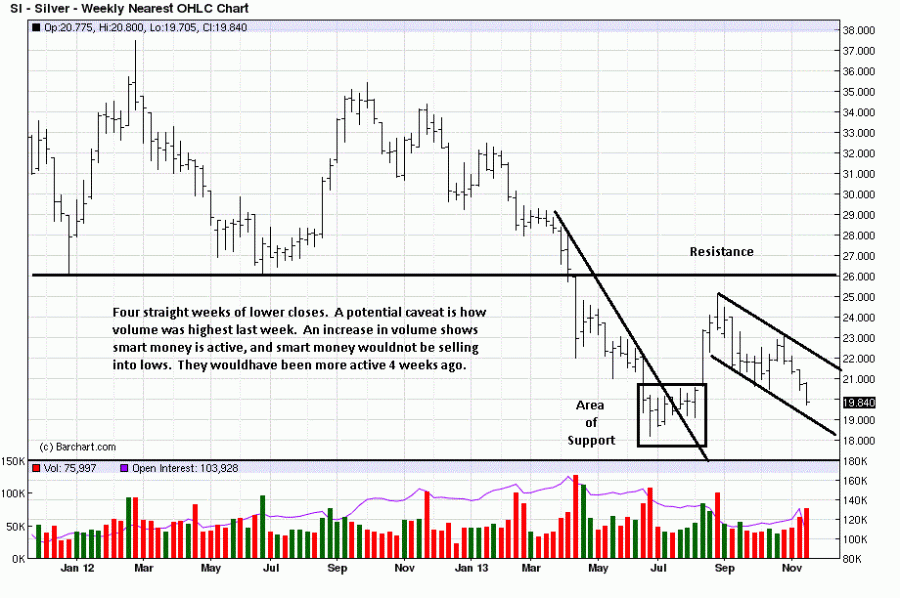
Volume is the market’s energy indicator. The greater the volume, especially at an area of support, (and resistance, as well), the greater one needs to pay attention. It is “smart money” that creates volume and moves markets. It is the public that responds, almost always at the wrong time, (selling lows, buying highs).
If smart money wants to move a market lower, it sells, (creating greater volume) at higher price levels, in anticipation of buying in at lower levels. Look at the high volume low in June. Weak hands were selling, sell stops being triggered, while smart money was on the other side, buying. Then note the high volume at the swing high at the end of August, the reverse effect.
Silver – Weekly Chart
Will the same hold true for this past week? We do not know. Volume was not as great, but we do not need to know, in advance. If a swing low develops, there will be evidence of one on the lower time frames that may afford a low-risk entry. That, in turn, depends on ones’ trading style. The point is to see how it is the market that provides the most reliable information.
Silver – Daily Chart
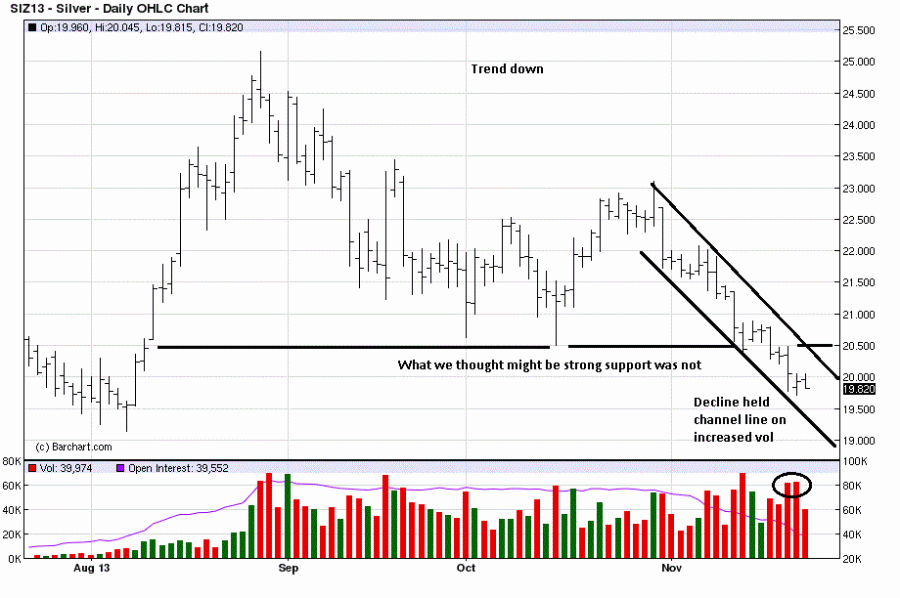
The daily chart below appears as the weakest in position of the three time frames. It is closer to a potential turnaround, or ready to head for new lows.
The increase in volume on Wednesday, and slightly higher on Thursday, tells a similar potential story as the daily gold chart. It is always best to let the market show its hand, and then follow. Examples of that were given on the weekly chart with the June low and August high. These signs work on all time frames.
Conclusion
Buyers, or Stackers, should continue unabated. Those looking to trade paper futures have no reason to buy. We have not been advocates of the short side because we do not like the company and refuse to be a party to their efforts.
[Editor’s Note: The author’s views and conclusions in the above article are unaltered and no personal comments have been included to maintain the integrity of the original post. Furthermore, the views, conclusions and any recommendations offered in this article are not to be construed as an endorsement of such by the editor.]
*http://edgetraderplus.com/market-commentaries/gold-and-silver-charts-tell-the-story-decline-not-over
Other Related Articles:
Many events moved the market this month which are all very bullish for gold. In addition, gold’s leading indicator is currently at a major low area all of which strongly reinforce the likelihood of an upcoming sustained rise. Let us explain. Read More »
We are now starting the hyperinflationary phase in the USA and many other countries – and this will all start in 2014. What will be the trigger? The answer is simple – the fall of the U.S. dollar. Read More »
Other Noonan Articles:
1. Noonan on Gold & Silver: “When Fundamentals Fail, Charts Prevail” & This Is What They’re Conveying
Fundamentals are relative, charts are absolute. They accurately reflect all that is going on, regardless of reasoning/motivation and…right now, the charts are letting us know that higher PM prices are unlikely to occur anytime soon. Barring some kind of “overnight surprise” that will shock the markets, odds favor lower prices over higher prices unless and until demand shows up in chart activity. Read More »
2. Noonan: When Will Silver Rise to Higher Values? Here’s the Answer
It takes time to turn a market around, and silver is in that process. There is no degree of certainty that a bottom has been reached, but there exist at least a probability the recent lows may hold. Whether the lows hold or not, one cannot lose sight of why accumulating silver has been so important. When price finally accelerates higher, the trying of one’s patience will quickly be forgotten and all will be well. Read More »
3. Noonan: Charts are Infallible! Here’s Why & What They’re Saying About Gold & Silver
Some of the finest and most highly regarded minds in the world of PMs have been saying gold and silver are going higher…[but] the charts have “said” otherwise, and that has been the correct read…The fundamentals may be as bullish as can be [but] the charts are sending a different message. Read More »
4. Noonan: Gold & Silver Could Move Sideways for Another 1-2 Years – Here’s Why
Using past history of how price responds, it is likely that gold, and silver, could move sideways for another year or two. While this flies in the face of so many current, supposedly “expert”, opinions [mine is not based on opinion but, rather, is strictly based on the facts as conveyed by the charts. Take a look and you will see that too!] Read More »
5. Noonan: These Charts Clearly Show What’s Happening With Gold & Silver – Take a Look
Below is a perfect example of how the charts timed the movement in the price of gold and silver over the past week. Yes, you CAN time the market as this article clearly demonstrates! When the market “talks,” we listen.] Read More »
The window of opportunity to buy physical gold and silver continues to narrow. Like the housing market top was known to be coming, when it came, those who waited too long regretted it. When the bottom for the physical PMs is known as a certainty, those who waited for a “better price” may also regret that decision. It is all about choice. Read More »
In an election, it does not matter if voter turnout is high or low, the outcome is determined by the actual votes cast. The same holds true for the markets. Only those who make an actual buy or sell decision determine the outcome of the market trend. The market “voters” turn up in charts, recorded in the price range, close, and volume. Collectively, a “story” unfolds, and it usually is an accurate one as it does not include any opinions. Opinions do not matter. Articles written about fundamentals, pundit declarations, etc., all fall under the category of opinions. The market is the best source for information, and that is a fact. Read More »
…Fiats have an unbroken track record of failing throughout all of history. Gold also has an unbroken track record of being a store of value for over 5,000 years. Yes, there have been hiccups along the way, and we are in one now. It is what it is, but what it is is also an incredible buying opportunity at “fire sale” prices….[That being said,] a look at the charts of the paper-tracked PM market [beg the question] … “Where’s the beef?” Where is the substance of anything? We see none in the charts. Take a look. Words: 610; Charts :4 Read More »
Technical analysis is a measure different from fundamental analysis…and we qualifying our approach with a specialized subset of technical analysis. How so? We read price and volume behavior, over time, in the form of developing market activity. It is what one sees on a chart, price ranges, close locations, volume, time factor[s], but no more. Below are charts that suggest that the weakness in silver may be coming to an end, sooner now rather than later, but that for now, it is what it is – and what is, is reality. Read More »
You will read more and more articles touting how gold and silver have bottomed. They have not, at least according to price behavior as determined by actual buyers and sellers in the market. Read More »
Charts speak the loudest…and they never lie…[because they are] the true record of all buy and sell decisions executed, coming from the most informed to the least informed. Most of the problems lie with those who form an opinion, and how they choose to impose it onto what any given chart “says.” My understanding of what the quarterly monthly, weekly and daily charts are conveying about the price action of silver is, simply,] “Silver stackers, these lower prices are a gift you should keep on taking. Stay tuned.” Read More »
12. Noonan: Charts Suggest NO Ending Price Action In Either Gold or Silver – Take a Look!
Not one Precious Metals guru has gotten anything right in the last 18 months. All have been calling for considerably higher prices. Over the past several months none called for sub-$1,300 gold and sub-$20 silver. Crystal balls do not work and never have. When it comes to markets, anything can happen [but the charts convey that] there is no apparent ending action suggesting a selling climax or even a cause for a reaction rally. Take a look. Read More »
 munKNEE.com Your Key to Making Money



I believe that what we are seeing when we study current PM charts is that PM’s value is being manipulated, as never before; which makes sense if you believe that the Big Banks are3 trying every trick in the book to force PM’s lower so they can obtain as much Gold (and other PM’s) as they can before what they are doing become general knowledge!
Think Fiscal musical chairs… When the music stops those not sitting on PM’s will be out of the next game!
Deep Throat advised “Follow the money”, I therefore believe that if China, Russia and others are still acquiring PM’s then so should all long term investors…
Imagine just this one scenario, The US Stock market climbs while other foreign banks buy PM at discounted prices, until the US$ stops being the worlds currency; overnight PM will skyrocket, the US$ will plummet and all those not in on the “deal” will suffer, as their portfolio’s value becomes a small fraction of its previous worth.