There has been so much talk about gold and so little understanding of the reality behind the move in the price of the yellow metal over the last 90 plus days that I think it’s necessary to separate the wheat from the chaff. I want to discuss what gold has done, where it’s at now, and then end with where it’s going from here and postulate why it’s going to do what it will do. Words: 1083
So says Giuseppe L. Borrelli (www.unpuncturedcycle.com) in edited excerpts from his original article*.
Lorimer Wilson, editor of www.FinancialArticleSummariesToday.com (A site for sore eyes and inquisitive minds) and www.munKNEE.com (Your Key to Making Money!) has edited ([ ]), abridged (…) and reformatted (some sub-titles and bold/italics emphases) the article below for the sake of clarity and brevity to ensure a fast and easy read. The article’s views and conclusions are unaltered and no personal comments have been included to maintain the integrity of the original article. Please note that this paragraph must be included in any article re-posting to avoid copyright infringement.
Borrelli goes on to say, in part:
Gold in a Major Bull Market
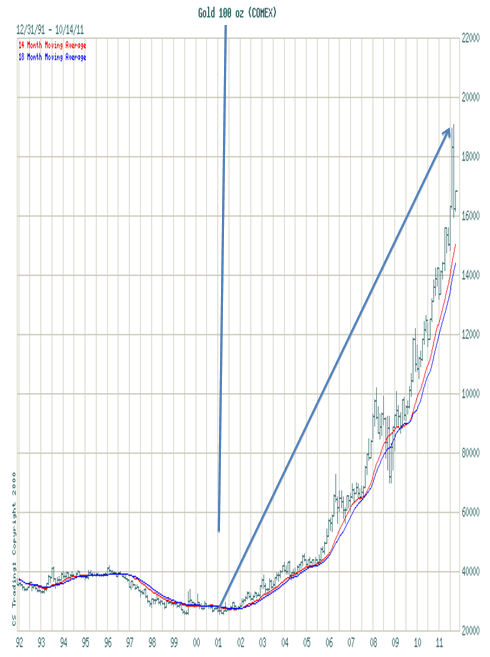
Gold is beginning the twelfth year of major bull market; perhaps the most unprecedented bull market in our lifetime. [Below is] a quick snapshot of what that bull market has looked like since the 1999 bottom and the 2001 retest of that bottom. From the point of view, as an investor, this is about as beautiful as it gets.

Gold has posted gains in each and every year [of its bull market run]. Below I have listed gold’s closing price on the last day of each year:
2000 — $273.60
2001 — $279.00
2002 — $348.20
2003 — $416.10
2004 — $438.40
2005 — $518.90
2006 — $638.00
2007 — $838.00
2008 — $889.00
2009 — $1096.50
2010 — $1421.40
2011 — $1566.80
Gold Price Corrections
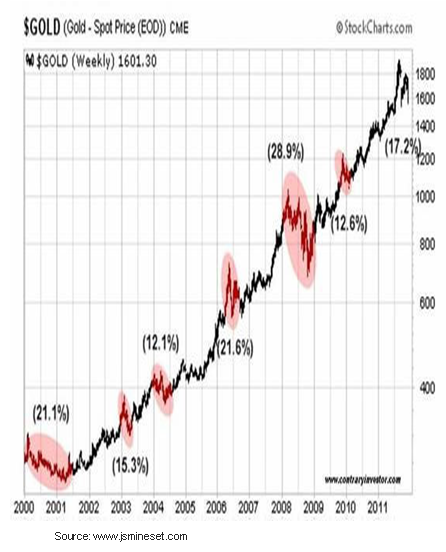
Now I want to look at the same time period but from a different perspective, this time in terms of corrections, because every primary bull market of any duration experiences secondary corrections. Every significant move in price has reactions and there is no way around it; you just have to be smart enough to recognize it for what it is, a reaction, and sit tight. So here it is:

Gold Has Bottomed In Price
If you include the current reaction, the eleven year old bull market is now in its seventh correction and the previous six have run anywhere from 12.1% on the low side to 28.9% on the high side. The current reaction that has led to all the negative rhetoric is stuck right in the middle at 17.2% and yet the media trips over itself to call a top, just like they did the other six times. I would like to point out that they were wrong then and they are even more wrong now, if that’s possible, and here is why.
Who in the world is currently reading this article along with you? Click here
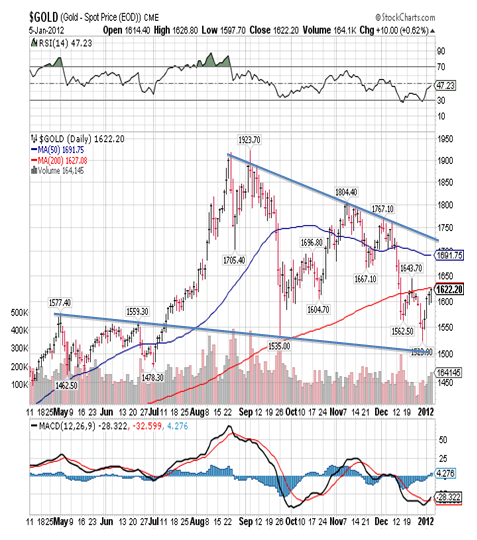
[Below] I have drawn a very simple nine-month daily chart of gold and I’ve put in the only two lines that matter. The top line is downward sloping and represents resistance while the bottom line is also downward sloping and represents support…:

One of the reasons I believe we’ve seen the bottom has to do with the 90-day cycle, one of the most dominant cycle’s in the markets over the last decade. Gold topped with an all-time closing high of 1,900.60 on August 22nd and then declined to a closing low of 1,548.70 exactly ninety days later. That in my opinion is not a coincidence. Since then gold has rallied to [in excess of $1,700/ozt.].
COMEX Days Are Numbered
Perhaps the most important development in the world of gold has to do with the fact that China, one of the world’s largest importers of gold, is no longer content to buy their precious metal [on] the floor of the COMEX or London metals exchange. Why? There are two principal reasons:
- The COMEX has more than US $86 billion in contracts (obligations) floating around at any one time. Yet in storage they have slightly less than US $3 billion. So the COMEX is not only woefully short of supply should there be a run, they are allowing large traders to flood the market with paper gold in an effort to suppress the price. If you’re China and you’re building your inventory, that’s not in your best interest.
- There are questions regarding the purity of the metal sold by the COMEX and London metals exchanges.
I should mention that a number of larger players, like Sprott and Kyle Bass, are following in China’s footsteps and are now going straight to all the large mining companies and are inking deals to buy all their production right from the source! That means that the flow of physical into the COMEX will slow to a trickle and eventually dry up altogether and the end result will be a default by the COMEX and a collapse of the paper system.
Price of Gold Has Not Topped
Finally, all of those calling for an end to the gold bull market seem to forget one important thing. All major bull markets end with a spike up based on greed and euphoria and not a top molded out of fear and despair, as would be the case today…
Gold has not topped…and if I am right that the bottom is in then we are about to embark on the third and final phase of our bull market, and that’s the phase where the general public finally piles into the gold market. It is almost always the most lucrative phase and it is the phase that always caps a major bull market.
Conclusion
The third phase will take gold up and through US $4,000 with fewer interruptions than most could imagine. My advice is to buy gold (silver) here and hide it some place until all the smoke clears.
*http://www.top40goldstocks.com/article-Gold-Bottom-Targets-Trend-To-4,000.html
Why spend time surfing the internet looking for informative and well-written articles on the health of the economies of the U.S., Canada and Europe; the development and implications of the world’s financial crisis and the various investment opportunities that present themselves related to commodities (gold and silver in particular) and the stock market when we do it for you. We assess hundreds of articles every day, identify the best and then post edited excerpts of them to provide you with a fast and easy read.
Sign-up for Automatic Receipt of Articles in your Inbox or via
FACEBOOK | and/or
TWITTER so as not to miss any of the best financial articles on the internet edited for clarity and brevity to ensure you a fast an easy read.
Related Articles:
1. Alf Field: Correction in Gold is OVER and on Way to $4,500+!
There is a strong probability that the correction in the price of gold [down to $1,523] has been completed. The up move just starting should be…the longest and strongest portion of the bull market…at least a 200% gain… [to] a price over $4,500. The largest corrections on the way to this target, of which there should be two, should be in the 12% to 14% range. [Let me explain how I came to the above conclusions.] Words: 760
2. Rebound Ratio Suggests New High for Gold By Mid-year
[While] some investors are frustrated,, and a few are worried that gold seems stuck in a rut [such a] stall in price has happened before…[but has] always eventually powered to a new high…[Let’s] examine the size and length of past corrections and how long it took gold to reach new highs afterward. Words: 7403. Buy Gold NOW Ahead of Further QE – Here’s Why
Due to high unemployment and a weak recovery world central bankers are focused on weakening their currencies to boost exports. [As such,] I think [even more] quantitative easing and other currency intervention is in our future…[and this will further increase]…both inflation and the price of gold. Let me explain with a few charts.] Words: 350
4. Goldrunner Called $1,920 Gold High Exactly; Now Expects $3,000 – $3,500 by Mid-Year
Short-term volatile moves in Gold, as we have seen over the past few months, do not affect our projections for the future price of Gold based on our fractal (pattern) “model” off the late 70′s Gold Bull. Just as we correctly projected the $1,920 high in our April article entitled Goldrunner: Gold on track to Reach $1860 to $,920 by Mid-year (gold reached $1,917.20 in late August and $1,923.70 in early September, 2011), our current analysis indicates that Gold will enter a range between $3,000 and $3,500 by mid-year 2012. Words: 975
5. Contracting Fibonacci Spiral Puts Gold Near $4,000 by 2013 and $7-10,000 by 2020
Gold is operating on a smaller Contracting Fibonacci Spiral Cycle that is in synch with the larger Contracting Fibonacci Spiral the markets are in. Adding together the sum of parts… the price of gold will move up in price in 2013, 2016, 2018, 2019 and 2020, with each subsequent leg moving less in percentage terms than the prior move. Gold advanced 4 foldish from 1999 until 2008 ($252/ounce to $1046/ounce) suggesting that gold should top out below $4000/troy ounce by the end of January, 2013…[on its way] to $7,000 and $10,000 per troy ounce by 2020. [Let me explain.] Words: 834
6. These 8 Analysts See Gold Going to $3,000 – $10,000 in 2012! Here’s Why
Back in 2009 I began keeping track of those financial analysts, economists, academics and commentators who were of the opinion that it was just a matter of time before gold reached a parabolic peak price well in excess of the prevailing price. As time passed the list grew dramatically and at last count numbered 140 such individuals who have gone on record as saying that gold will go to at least $3,000 – and as high as $20,000 – before the gold bubble finally pops. Of more immediate interest, however, is that 8 of those individuals believe gold will reach its parabolic peak price in the next 12 months – even as early as February, 2012. This article identifies those 8 and outlines their rationale for reaching their individual price expectations. Words: 1450
7. Gold Will Reach $3,000/$4,000/$5,000 Before This Bull Market Is Over! Here are 12 Factors Why
I believe that the price of gold will… reach… $3,000, $4,000, and even $5,000 [per troy] ounce…during the course of this long-lasting bull market, a bull market that still has years of life left to it…[although] prices will remain extremely volatile – with big swings both up and down along a rising trend…The future price of gold is a function of past and prospective world economic, demographic, and political developments [and in this article] I review some of these developments and trends – so that you can come to your own “golden” conclusions. Words: 3800
8. New Analysis Suggests a Parabolic Rise in Price of Gold to $4,380/ozt.
According to my 2000 calculations, if interest rates and inflation stay constant over the next 2 years, we could expect to see (with 95.2% certainty) a parabolic peak price for gold of $4,380 per troy ounce by then! Let me explain what assumptions I made and the methods I undertook to arrive at that number and you can decide just how realistic it is. Words: 740
9. When This Pullback in Gold is Put into Perspective It’s No Big Deal – Here’s Proof
Daily and monthly gyrations in the price of gold are nothing to fret over…The price will recover and, in time, fetch new highs…Here’s proof. Words: 264
 munKNEE.com Your Key to Making Money


