The gold miners-to-gold ratios are indicators that show how many gold ounces are required to purchase one share of an index. Technically, the numbers are the value of the index divided by the price of gold. They show a relative value of miners to the price of bullion, thus indicating whether gold stocks or gold are overvalued or undervalued relative to each other. When the ratios are low, miners are cheap compared to gold, and when the numbers are high, gold stocks look expensive relative to bullion. Let’s examine a chart [to see what it says is the situation these days].
The comments above and below are excerpts from an article by Arkadiusz Sieroń (SunshineProfits.com) which has been edited ([ ]) and abridged (…) to provide a faster and easier read.
As the chart below shows, the HUI-to-gold ratio (the HUI…does not include silver producers and long-term hedgers) used to trade between 0.24 and 0.39, with an average of 0.32.
Chart 1: The price of gold (yellow line, left axis, London P.M. Fix, in U.S. dollars), the HUI Index (red line, left axis) and the HUI-to-Gold Ratio (blue line, right axis) from 1996 to 2016.
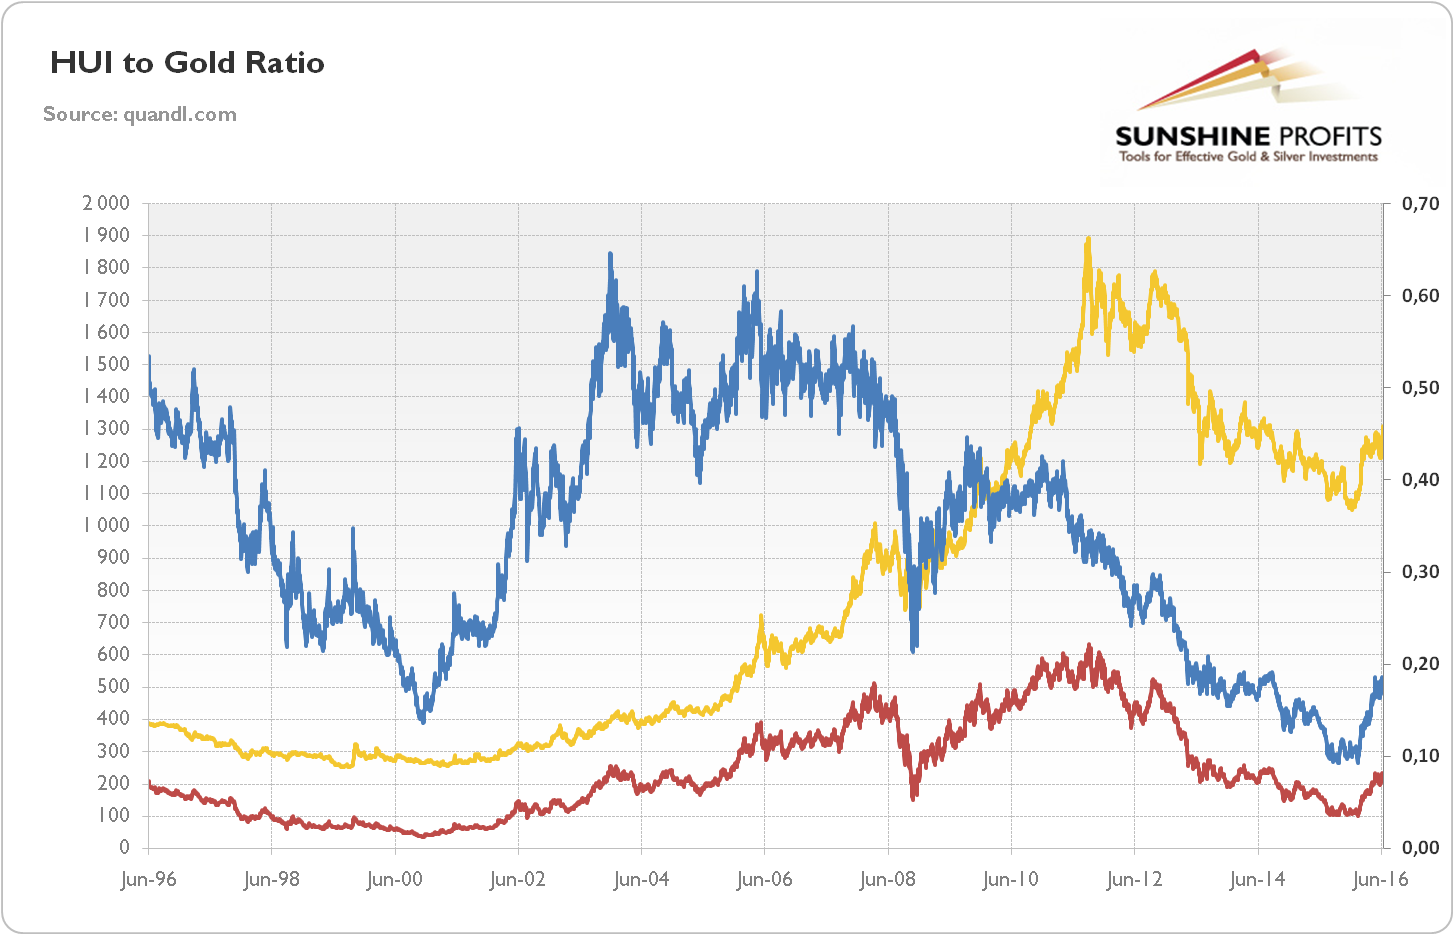
- In the 1990s, the ratio was falling, and then it bottomed in 2000. It means that back then gold stocks were very cheap in relation to bullion.
- Then, the number almost quadrupled until 2003. Gold miners were then overvalued compared to the price of the metal.
- Since 2006, the indicator has declined (with a plunge under way during the 2008 financial crisis and a partial rebound afterwards) until 2016.
Although several mining stocks have soared this year, the HUI-to-gold ratio still remains at a historically low level. Hence, some analysts predict the reversal in gold shares to a more sustainable range. However, there may be a ‘new normal’ in the relationship between gold stocks and bullion at a lower level…[because]
- the introduction of ETFs and other paper gold products enabled investors to have exposure to gold without having to buy mining stocks.
- the stock performance has been relatively poor due to lousy returns generated by the underlying business. Gold mining is a very challenging sector without many investment opportunities (i.e. easily accessible gold fields) on hand. Given its tiny market value and dependence on external financing, it is prone to inflows of speculative capital, mal-investments (booms often lead to sub-optimal capital allocation) and deflationary credit crunches.
- There were also sharply rising input costs, but during the gold bull market the industry relied on ever higher price assumptions, increasing producing and undertaking expensive takeovers. Some analysts even argue that the 2000s gold stock boom was a bubble, or “the mining equivalent of Chinese ghost cities”.
Certainly, there is a positive correlation between gold prices and stocks of mining companies producing it. This relationship is stronger in the short-run than in the long-run because producers are affected by many other factors than the price of the yellow metal, such as hedging, costs structure or management. This is why it is not unusual to see a divergence between these two distinct classes of assets.
Conclusion
The analysis of the…HUI to bullion ratio shows that the metal has been outperforming equities since…2006 until 2016. This year, the gold market has changed: the gold prices increased about 20%, while the HUI index more than…doubled. After such an impressive comeback, some analysts expect a continuation of gains and a return of these ratios to historical averages. Their hopes seem to be exaggerated, however, as production costs are a few times higher now than they were in the glorious past, which negatively affects the companies’ profitability.