This article reveals how gold, silver, PM mining stocks and the S&P 500 performed each year of the 4-year presidential election cycle, on average, and suggests how one should invest in the various assets in the years to come.
The comments above and below are excerpts from an article by Arkadiusz Sieroń (SunshineProfits.com) which have been enhanced – edited ([ ]) and abridged (…) – by munKNEE.com (Your Key to Making Money!)
to provide you with a faster & easier read.
Gold’s Average Annual Return In Presidential Election Years From 1973 to 2016
The chart below shows how gold performed each year of the 4-year presidential election cycle from 1976 to 2016:
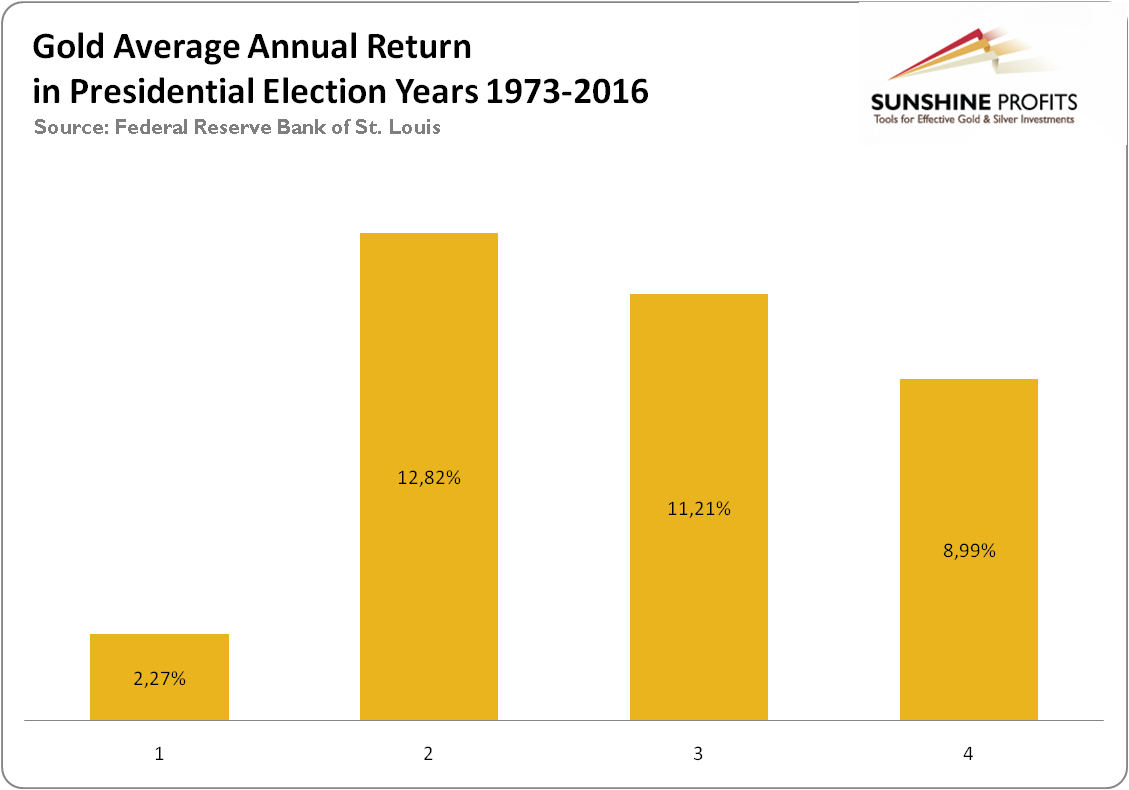
(…Investors should be aware that [the above] analysis is based on rather few observations. It is very sensitive to the period chosen and the pattern does not always hold. For example, during presidential election cycle 1973-1976, gold performed the strongest in the first year after Nixon’s re-election…)
[As a result of the above caveat,] we are a bit skeptical as to whether we can apply such a historical analysis to the current environment of sluggish global economic growth and negative interest rates in many countries, but the difference between gold’s performance in a post-election year and other years is too large to ignore.
…[In the chart below] we present the average annual returns of gold (1972-2015; yellow line), silver (1972-2015; blue line), the S&P 500 (1948-2015; green line) and the gold equity indices XAU (1984-2015; purple line) and HUI (1997-2015; red line).
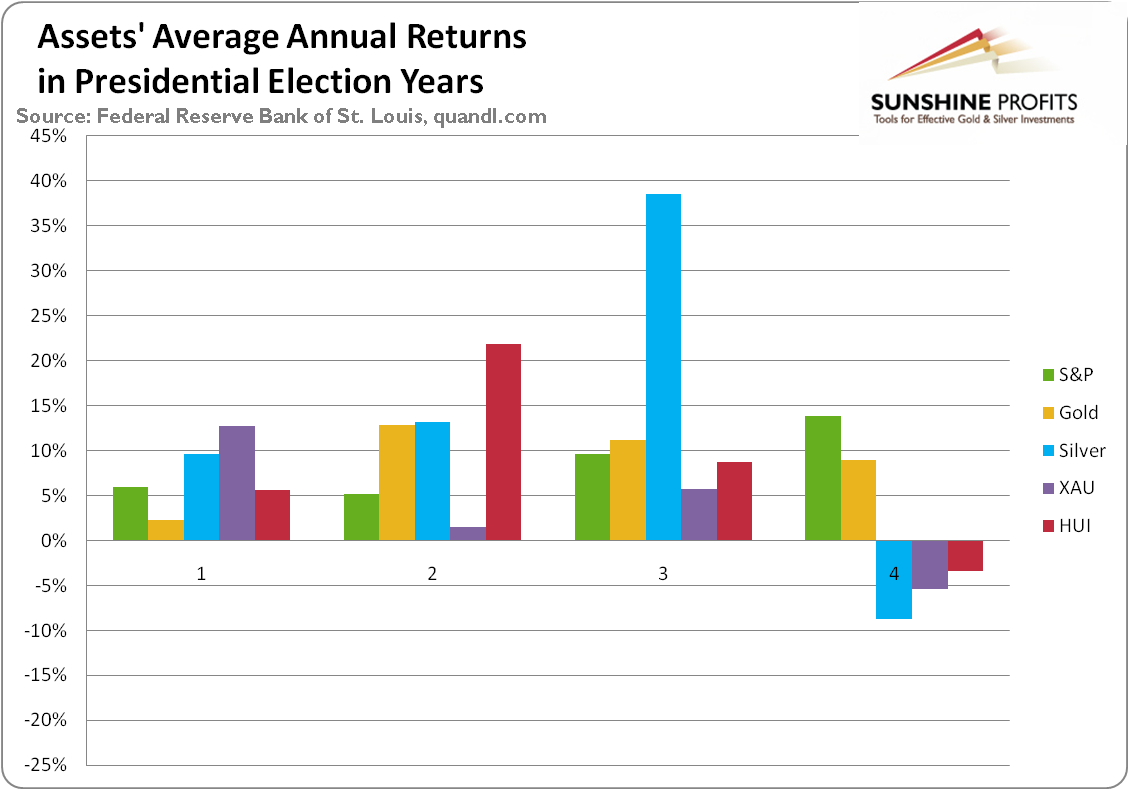
As can be seen, there is hardly any clear pattern:
- Gold performs the strongest in the midterm election year and the weakest in the post-election year.
- Silver performs the strongest in the pre-election year and the weakest in the election year…
- The S&P 500…performs better during the second half of the election cycle.
- Gold stocks prefer the first half of the term and hate the election year.
- the XAU index loves the post-election year,
- the HUI index is the strongest during midterm (please note that XAU outperforms HUI when silver outperforms gold as XAU consists of both: silver and gold miners, while HUI only includes gold miners).
Conclusion
Guided by this analysis, in general,
- investors should bet on gold, get silver, and get rid of gold miners from the portfolio in election years – but this year it wouldn’t be the smartest move, at least so far.
- Investors preparing for 2017 should underweight their positions in gold and overweight in silver or the XAU index, however they should be aware the data series for gold equity indices are particularly short and include few presidential election cycles…
Follow the munKNEE – Your Key to Making Money! “Like” this article on Facebook; have your say on Twitter; register to receive our bi-weekly Market Intelligence Report newsletter (see sample here , sign up in top right hand corner)