The above edited excerpts (and those below) come from the original posting* by
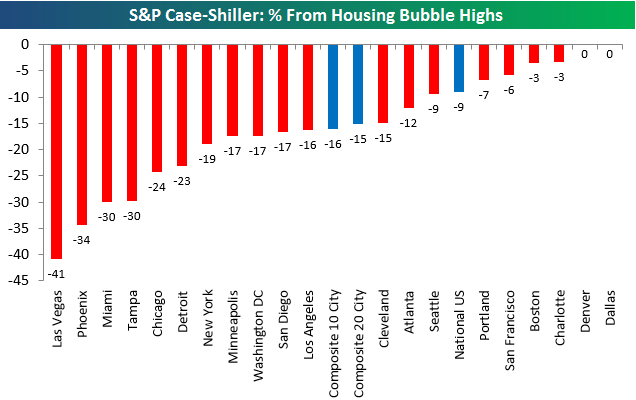
Below is a look at how far each city is still below its housing bubble highs reached in the mid-2000s.
- Denver and Dallas both surpassed their prior highs quite a while ago, but two more cities are getting close.
- As shown, Boston and Charlotte are now both just 3% away from reaching new highs in home prices.
- Three other cities are within 10% of their highs – Seattle, San Francisco and Portland.
On the negative side,
- Las Vegas is still 41% away from its prior all-time highs – the furthest of any city.
- Phoenix, Miami and Tampa are all 30%+ away from their prior highs as well.
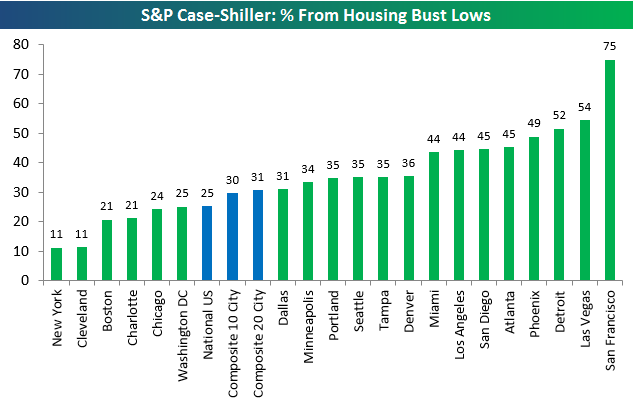
The chart below shows how much home prices have gained from their housing bust lows that were put in place in the late 2000s/early 2010s.
- As shown, San Francisco prices are now up 75% off their housing bust lows, which is far and away the biggest jump of any city.
- Two other cities – Detroit and Las Vegas – are up 50%+ off their lows.
- At the bottom of the list are New York and Cleveland, which have both gained just 11% off their lows.
- The two composite indices are now up roughly 30% off their lows.
Below we provide price charts of the 20 cities tracked by S&P/Case-Shiller plus the 10-city and 20-city composite indices.
- Most cities are still trying to trudge their way back to their bubble highs, but cities like Dallas and Denver have recently exploded higher.
- San Francisco is getting mighty close to a new high as well. The second tech boom has been very, very good for San Fran home prices, but you can’t help but worry about overheated markets when you see action like this.
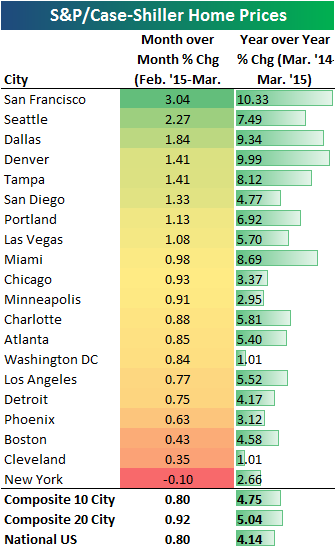
(click to enlarge)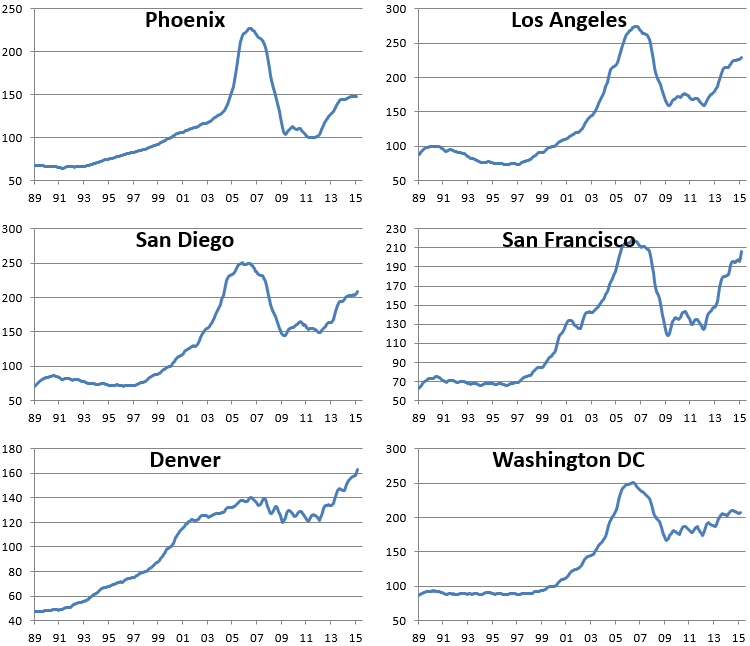
(click to enlarge)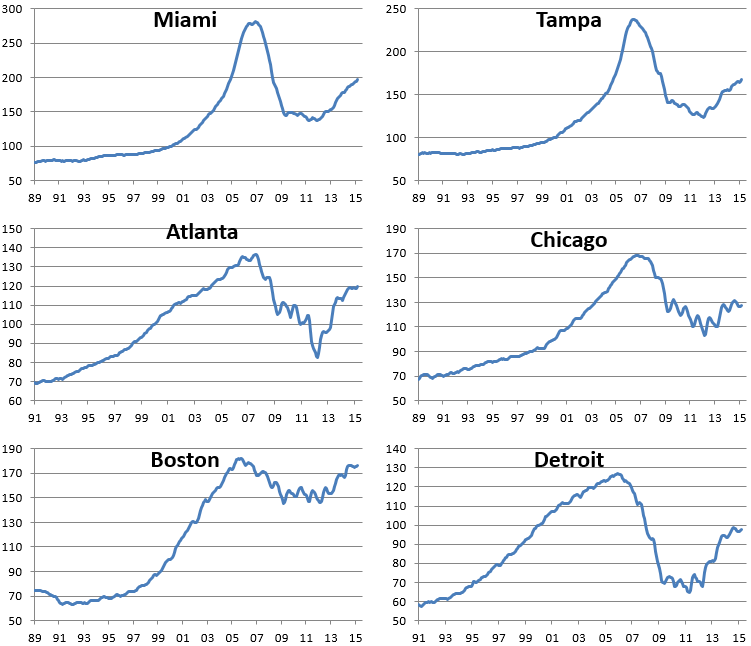
(click to enlarge)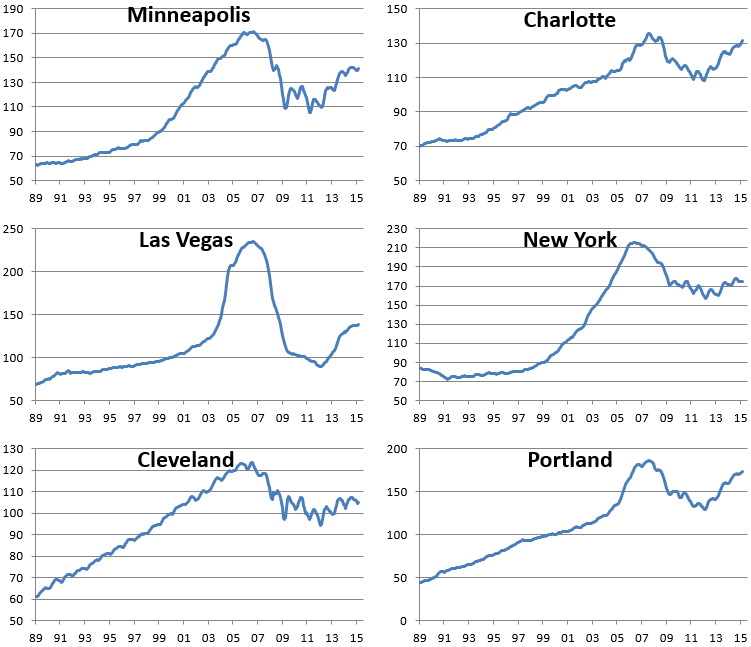
(click to enlarge)
Source: S&P/Case-Shiller Home Price Update and http://seekingalpha.com/article/3224086-s-and-p-case-shiller-home-price-update?ifp=0&app=1