Imagine that five years ago you invested $10,000 in the S&P 500. How much would it be worth  today, with dividends reinvested but adjusted for inflation?
The original article has been edited here for length (…) and clarity ([ ])
The purchasing power of your investment has increased to $18,542 for an annualized real return of 12.41%.
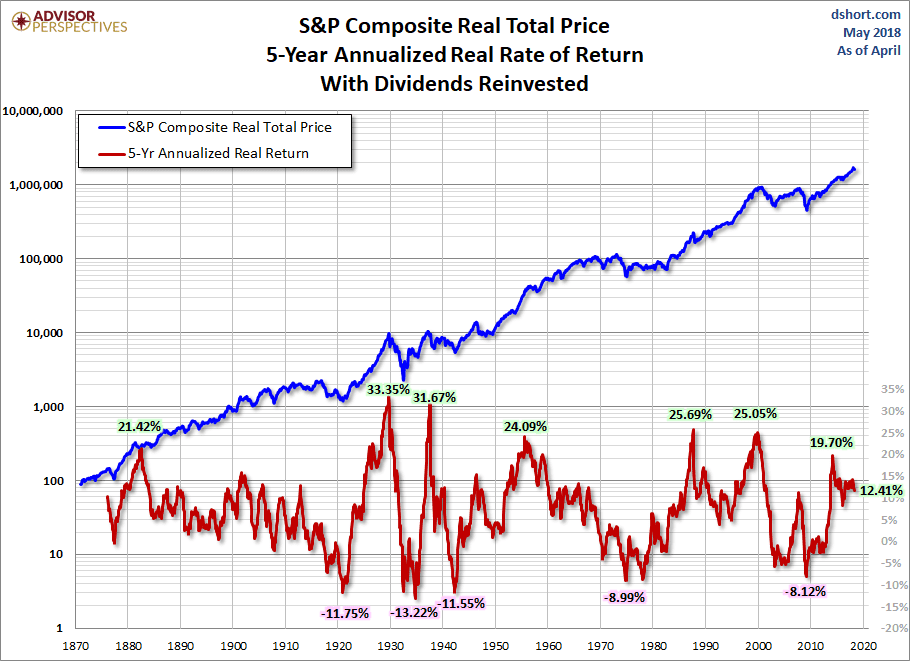
Had we posed the same question in March 2009, the answer would have been a depressing $6,654. The -8.12% real return would have cut the purchasing power of your initial investment by a third.
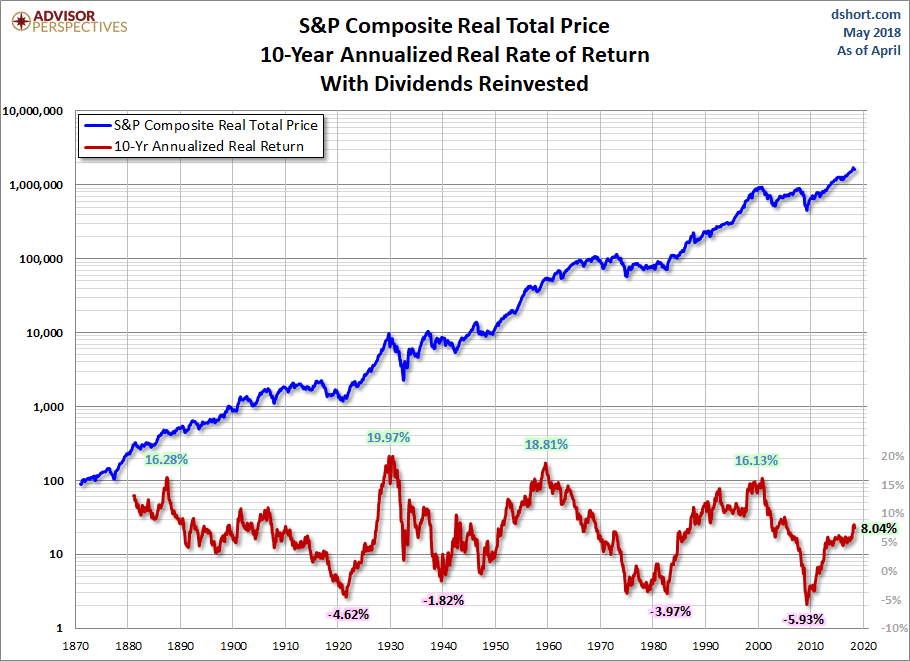
Let’s increase the time frame to 10 years. The annualized return is considerably smaller than the 5-year time frame. As of the end of last month, your $10K invested 10 years ago has grown to about $22.28K adjusted for inflation, an annualized real return of 8.04%.
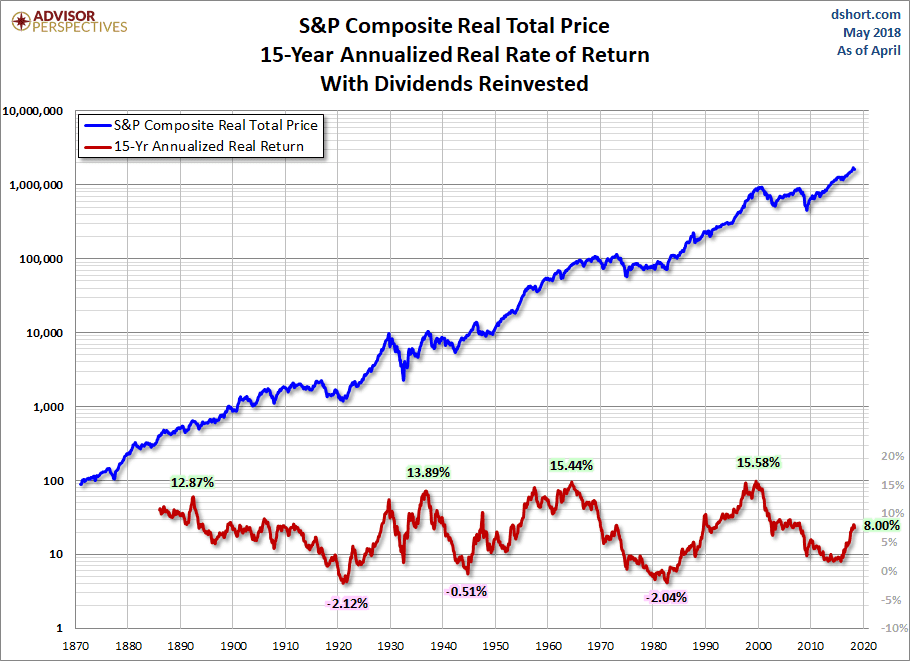
The 15-year time frame is only slightly more profitable. Your one-and-a-half decade investment of $10K has grown to about $33K adjusted for inflation for an annualized real return of 8.00%.
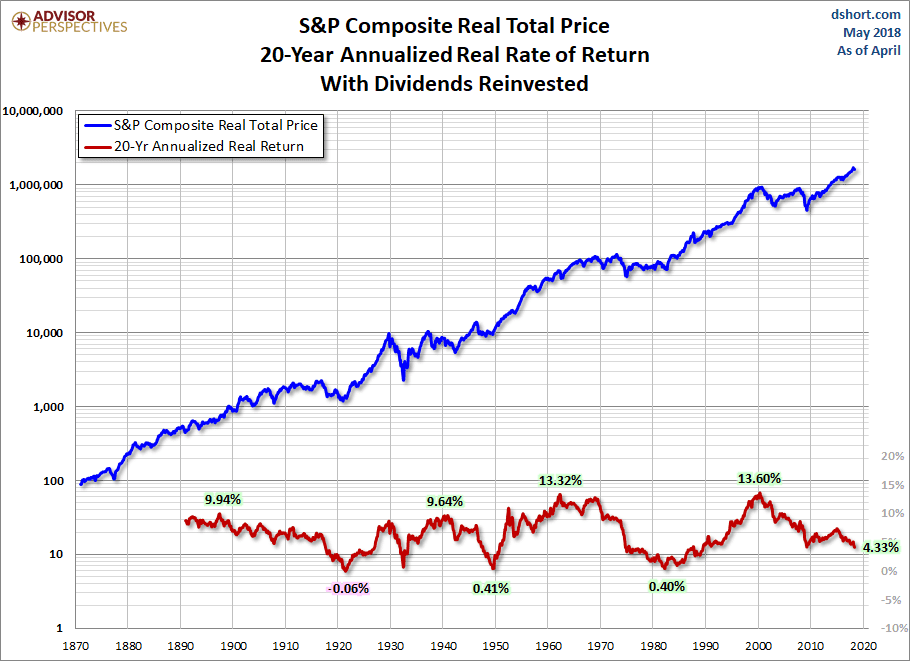
If we extend our investment horizon to 20 years, the roller coaster is less volatile with higher lows and lower highs.
The volatility decreases further with a 30-year timeline but, even for that three-decade investment, the annualized returns since 1901 have ranged from less than 2% to over 11%.
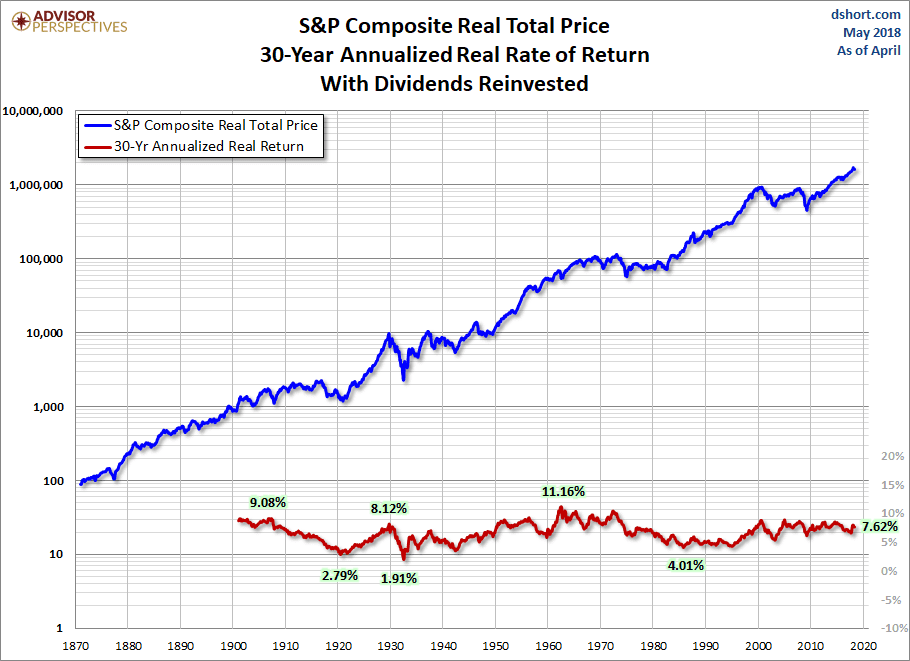
As the above charts illustrate, and as many households have discovered during the 21st century so far, investing in equities carries substantial risk. Households approaching retirement should understand this risk and make rational decisions about diversification.
 munKNEE.com Your Key to Making Money