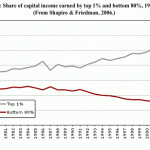
So asks Logan Brown (ivn.us) in edited excerpts from his original article/infographic* entitled What Happened to America’s Middle Class? (Hat Tip to SeniorD)
[The following is presented by Lorimer Wilson, editor of www.munKNEE.com and may have been edited ([ ]), abridged (…) and/or reformatted (some sub-titles and bold/italics emphases) for the sake of clarity and brevity to ensure a fast and easy read. This paragraph must be included in any article re-posting to avoid copyright infringement.]
Brown goes on to say in further edited excerpts:
…One important factor is the rise of a middle class in other developing industrialized nations, such as China. Much of U.S. unskilled jobs are being outsourced to emerging markets which offer much cheaper labor than within the U.S. 14 years ago the average household income in China was $760 in 2000 and it now starts at $10,000. The success in these emerging markets offers an explanation as to why portions of the U.S. middle class are struggling.
Divisions within the American lower-middle class and upper-middle class can be examined through the gap between skilled and unskilled workers, as well as through the massive disparities with white American household incomes compared to that of other ethnic minorities.
The current median wealth of white families is $113,149, $89,339 for Asians, $6,325 for Latinos, and $5,677 for African-Americans. In 1984, the wealth gap between white and black families sat around $85,000; however, that gap skyrocketed to $236,500 in 2009.
This massive gap among American skilled and unskilled workers demonstrates a rising trend: the outsourcing of unskilled labor to foreign states is slowly deteriorating the foundation of America’s middle class.

[Editor’s Note: The author’s views and conclusions in the above article are unaltered and no personal comments have been included to maintain the integrity of the original post. Furthermore, the views, conclusions and any recommendations offered in this article are not to be construed as an endorsement of such by the editor.]
*http://ivn.us/2014/03/21/happened-american-middle-class-infographic
Related Articles:
1. Never Have SO Few Owned SO Much – Where Do You Place in the Wealth Hierarchy?
2. The 1%: Net Worth of $8,232,000; Average Annual Income of $1,530,733 – and More Interesting Facts
You’d be in the top 1 percent of U.S. households if your income in 2010 was at least $516,633; your net worth in 2007 was $8,232,000 or more, and your average income this year is $1,530,773. Where did the top 1 percent make its money? [Take a look at the following charts for the answers.] Words: 1048 Read More »
3. How Much Do Americans Earn?
How much does the typical American family make? This question is probably one of the most central in figuring out how we can go about fixing our current economic malaise. In this article we break down the U.S. household income numbers. Words: 464 Read More »
4. How the Poor, Middle Class and Rich Spend Their Money
How do Americans spend their money and how do budgets change across the income spectrum? The graph below answers these questions. Words: 240 Read More »
Visit wsj.com – HERE – to find their calculator which shows where your household income stands compared to others in the U.S.. $506,000 puts you in the top 1%; the much talked about $250,00 in the top 6%; $200,000 in the top 10% while an annual salary of $43,000 puts you in the top/bottom 50%. Where do you stand? Read More »
 munKNEE.com Your Key to Making Money


The once middle class are now just part of the new poor, which are now in the process of becoming the long term unemployed by those that are downsizing while at the same time raising salaries for top management!
Every day that the President and the US Congress do not create jobs, many thousands more families run out of money and hope!