The following 27 charts provide a historical perspective on Gold in and of itself and its relation with Debt, Inflation and other factors. Anyone interested in gold should look at these charts.
[The charts in this post come from Incrementum* and are presented by Lorimer Wilson, editor of www.munKNEE.com and the FREE Market Intelligence Report newsletter (sample here). This paragraph must be included in any article re-posting to avoid copyright infringement.]
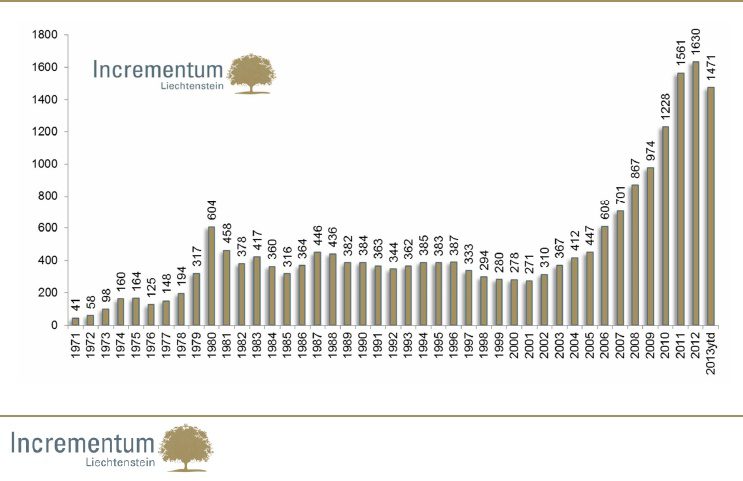
1. Average Annual Gold Price
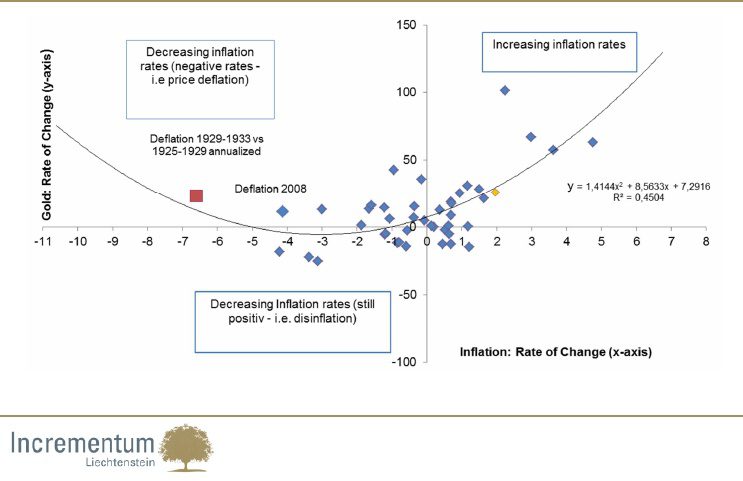
 17. Change in Inflation Rate vs. Change in Gold Price: Gold Does Not Correlate With Inflation Rates, But With the Change in Inflation Rates
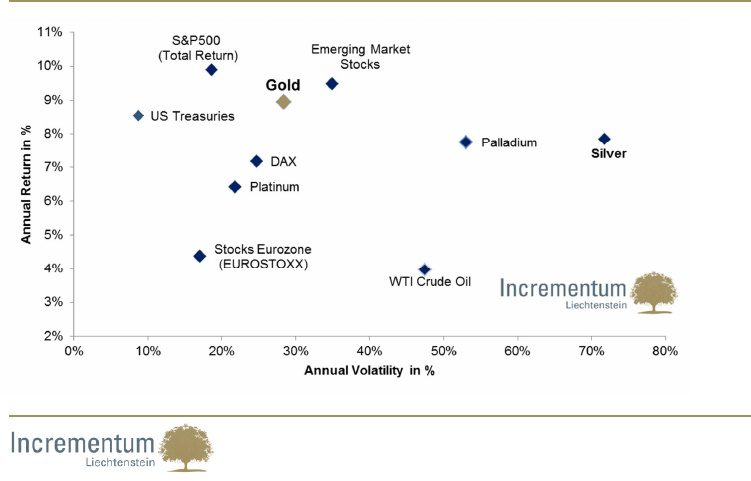
 18. Annual Return versus Annual Volatility since 1971
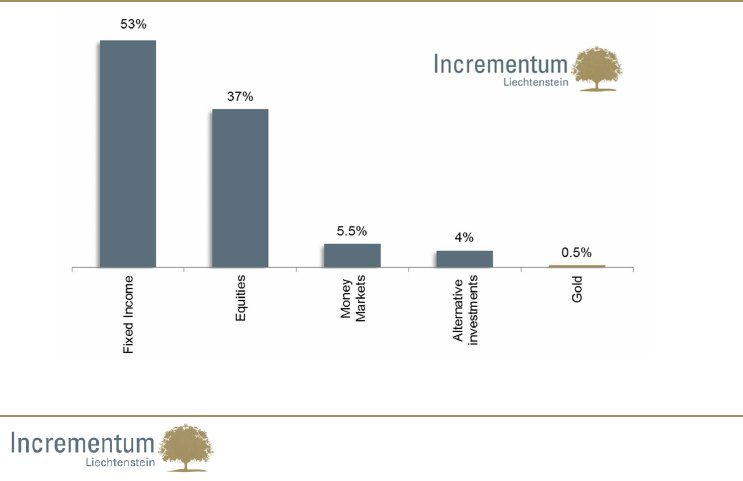
 19. Crowded Trade? Gold‘s Share of Total Financial Assets Currently at a Mere 0.5%
 20. Daily Trading Volume in Billion USD: Gold Is One of The Most Liquid Currencies
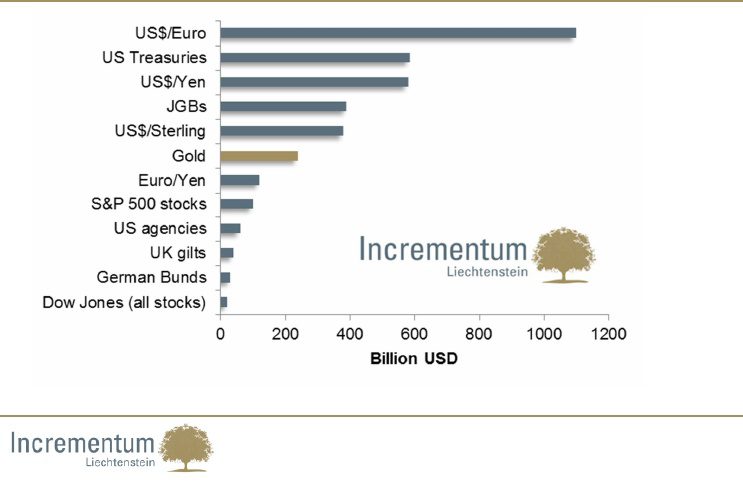 21. Average Daily Turnover as % of Total Outstanding
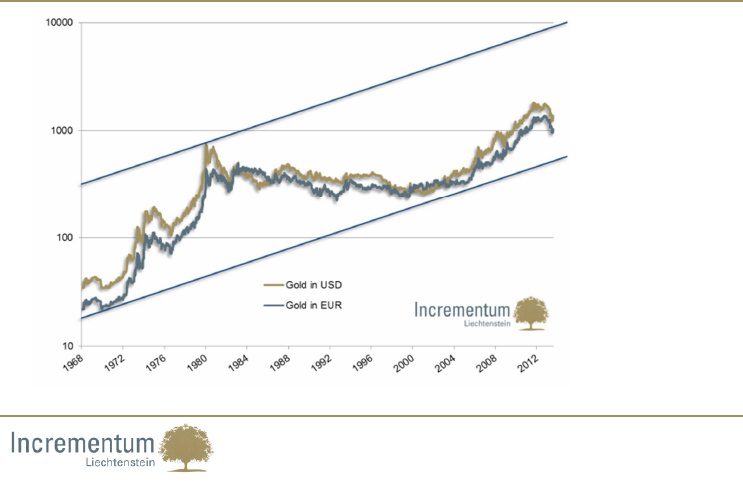
22. Gold in USD & EUR Since 1968 (Logarithmic Scale)
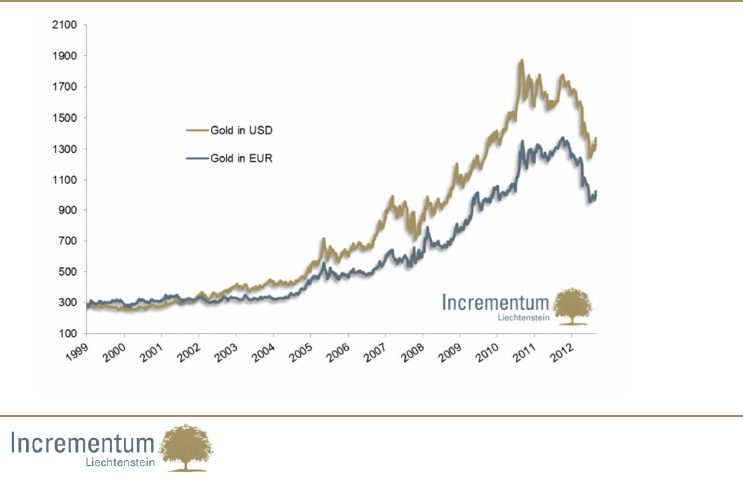
23. Gold Price in USD and EUR Since 1999
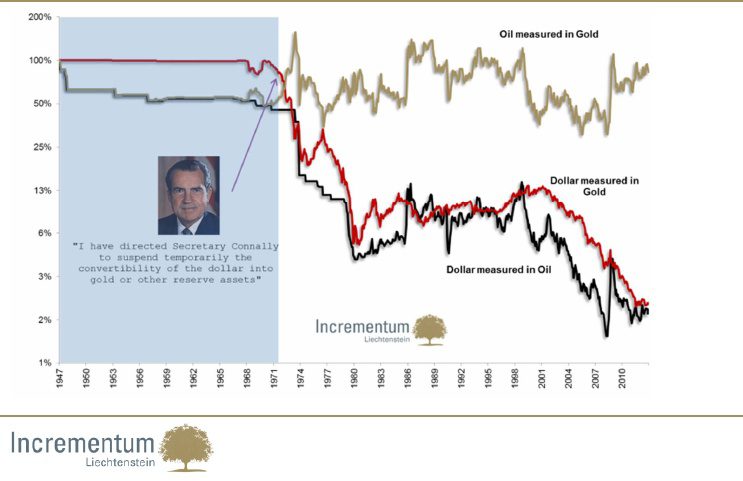
 24. Purchasing Power of the US Dollar Measured in Gold and Oil Terms vs. Purchasing Power of Gold in Oil Terms (log. scale)
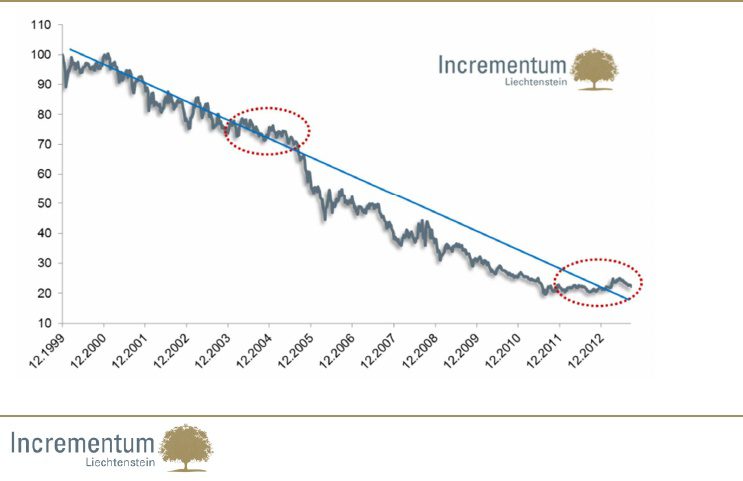
 25. Currency Basket* Measured in Terms of Gold: Long Term Downtrend Intact
 26. Combined Balance Sheet Fed + ECB (USD bn)
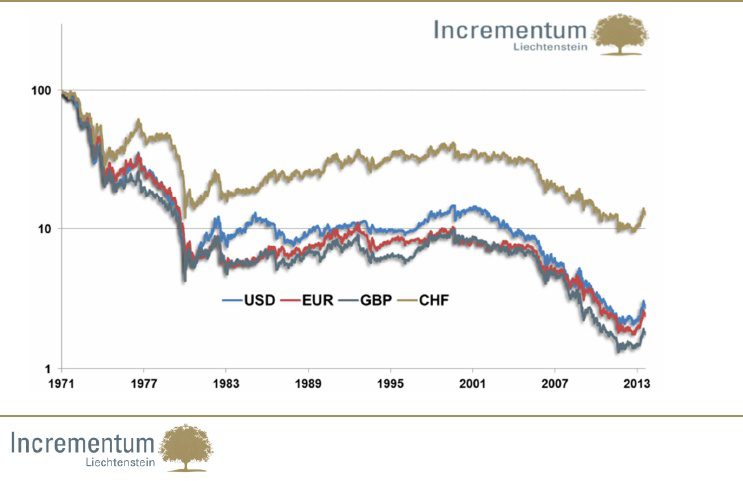
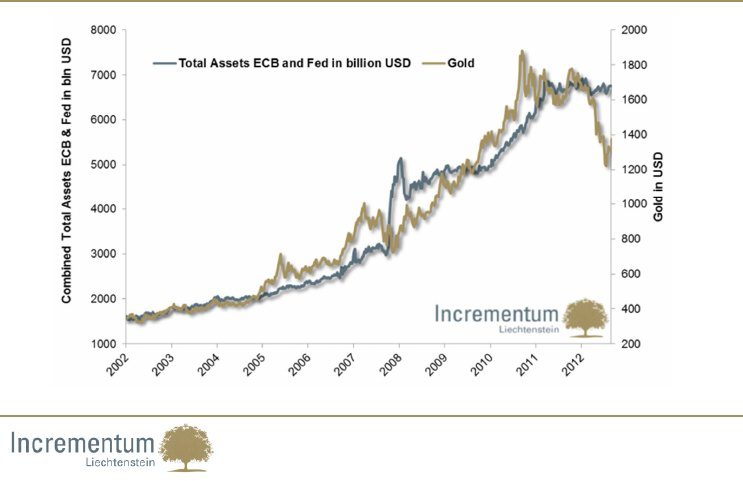 27. Purchasing Power in Various Currencies –How Much Gold Does One Unit of Currency Buy? (log. Scale, indexed to 100)
*http://www.scribd.com/doc/166098163/Chartbook-Incrementum-The-Gold-Bull-and-Debt-Bear
 munKNEE.com Your Key to Making Money



I have a question: When the various Governments and their Central Bank cronies in this interconnected world of Banking, i.e, the IMF, BIS, and the Banksters, etc, etc, decide,— enough is enough,–and decide to steal (as President Roosevelt did in 1934) by confiscating the Gold possessions of its Citizens and will ALL those Gold depositors i.e, the sheeple bend over backwards to comply again?
Will there be any country that will NOT co-operate? i.e, we are seeing the loss of Sovereignty in countries (like lets say Switzerland) giving up it’s depositors in compliance with USA fiscal and taxation demands, even today.
Or is there a PLAN of opposition to what I am certain is coming, but that I am not aware of?
Where is there REAL protection short of my drainpipe?
Gold and Silver not only will recover but “take off” as investor get caught blind sighted as the US$ and others begin to lose their shine due to Central Bank juggling!