Gold has been in a bull market for over a decade, posting positive returns for 11 years in a row. However, there are good reasons to believe that gold will retreat in 2012 and disappoint a lot of gold bugs. [Let me explain.] Words: 725
So says Robert Hallberg (http://www.contrarian-investor.com/) in edited excerpts from an article* which Lorimer Wilson, editor of www.munKNEE.com has further edited below for length and clarity – see Editor’s Note at the bottom of the page. This paragraph must be included in any article re-posting to avoid copyright infringement.
Hallberg goes on to say, in part:
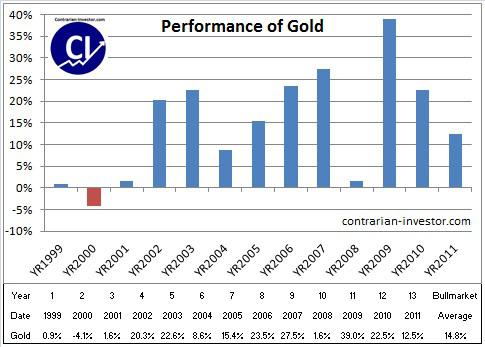
However, the 13th year of a bull market has typically been a year of weakness and retreat. Martin Armstrong points out that secular bull markets typically have a correction around the 13th year, and he refers to this phenomenon as the “13 year curse.”…
Home Delivery Available! If you enjoy this site and would like to have every article posted on www.munKNEE.com (approx. 3 per day of the most informative articles available) sent automatically to you then go HERE and sign up to receive Your Daily Intelligence Report. We provide an easy “unsubscribe” feature should you decide to opt out at any time.
Gold has been in a long bull market and we are now in or just passing the 13th year, depending on whether we start counting in 1999 when gold made its low or year 2000 when the Nasdaq peaked. The chart shows the year over year return in gold since year 1999.

Corrections are Healthy
A retreat in the price of gold does not mean that it’s the end of the bull market, but rather that gold is taking a breather to build a base for the next breakout. Gold has already made new highs 11 years in a row. A correction at this point is actually a healthy process, and only makes the bull market last that much longer.
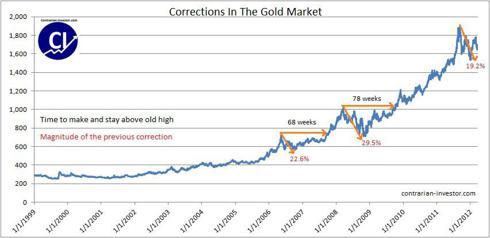
Gold made a 20% correction at the end of 2011, and if you look at historical corrections, it has previously taken anywhere from 68 to 78 weeks to make a new high and stay above the old high after a similar magnitude correction. Given that gold peaked out on September 6, 2011, a new high will not be reached until around December 2012 to March of 2013, if we use historical data as our only measurement tool. Given that this is an election year, we are perhaps likely to see more intervention by the authorities to boost the economy and suppress the price of gold.
The chart show previous corrections in the gold bull market:
The 3 Phases of a Bull Market
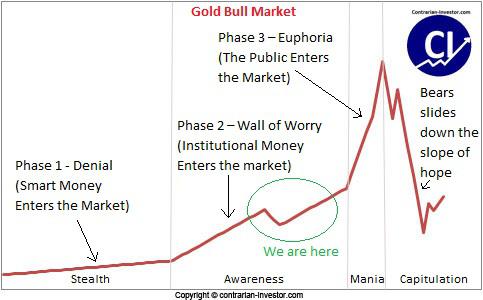
Despite what may be temporary weakness, I don’t suggest [that] anyone… sell their gold. Quite the opposite; gold is still in a secular bull market and any weakness represents a buying opportunity. The bull market in gold should still have several years left to run. If we use a traditional model for looking at a bull market we should be about two thirds in to the bull market; right in the middle of the “awareness phase.”
Before this market really starts to take off, we need to get Wall Street and more institutional buyers involved, most of which have been sitting on the side line. We will not see the mania phase until the public gets involved, and we are still far away from this happening. Martin Armstrong… believes that gold will get to the blow-off phase in 2017, but only time will tell if this is the case or not. The chart shows a sketch of a typical bull market and a guess on where we are today:

Conclusion
It’s in our human nature to want to see constantly rising prices to make us feel good but, unfortunately, the market does not operate like that. It “climbs a wall of worry” and shakes out all the weak hands. Only the investors with determination, patience and an understanding of bull and bear markets will be able to ride out the ups and down throughout the bull market and reap maximum rewards.
I suggest retail investors to buy the dips or perhaps take the emotions aside by purchasing metal on a set date every month on a dollar cost average basis…
*http://seekingalpha.com/article/458801-don-t-expect-new-highs-in-gold-this-year?source=email_macro_view&ifp=0 (To access the article please copy the URL and paste it into your browser.)
Editor’s Note: The above article has been has edited ([ ]), abridged (…), and reformatted (including the title, some sub-titles and bold/italics emphases) for the sake of clarity and brevity to ensure a fast and easy read. The article’s views and conclusions are unaltered and no personal comments have been included to maintain the integrity of the original article.
Related Articles:
1.Rebound Ratio Suggests New High for Gold By Mid-year
[While] some investors are frustrated,, and a few are worried that gold seems stuck in a rut [such a] stall in price has happened before…[but has] always eventually powered to a new high…[Let’s] examine the size and length of past corrections and how long it took gold to reach new highs afterward. Words: 7402. Goldrunner Called $1,920 Gold High Exactly; Now Expects $3,000 – $3,500 by Mid-Year
Short-term volatile moves in Gold, as we have seen over the past few months, do not affect our projections for the future price of Gold based on our fractal (pattern) “model” off the late 70′s Gold Bull. Just as we correctly projected the $1,920 high in our April article entitled Goldrunner: Gold on track to Reach $1860 to $,920 by Mid-year (gold reached $1,917.20 in late August and $1,923.70 in early September, 2011), our current analysis indicates that Gold will enter a range between $3,000 and $3,500 by mid-year 2012. Words: 975
3. Update: 51 Analysts Now Maintain that Gold is Going to $5,500 – $6,500/ozt. in 2015!
Lately analyst after analyst (161 at last count) has been climbing on board the golden wagon with prognostications as to what the parabolic peak price for gold will eventually be. That being said, however, only 51 have been bold enough to include the year in which they think their peak price estimate will occur and they are listed below. Take a look at who is projecting what, by when and why. Words: 644
4. For Mathematicians Only: A Precise Gold Price Prediction Formula
I have developed a formula that has predicted gold price precisely over the last 12 years. if it continues in a similar fashion for the next few years we should see gold at $4,875 a troy ounce in 2015. Words: 438
 munKNEE.com Your Key to Making Money


Although none come to mind, while there may be other good reasons to believe the gold price trend will retreat in 2012, a historical secular bull market period of 15 – 20 years – with an average of 17 years – isn’t one of them.
When forecasting, many economists and commentators fail to focus on the dramatic change in inter-country dependence in our ever more globalized world, and on financial market game-changers wrought by high frequency algorithmic trading, among other things. Historic data generated from fundamentally different economic and technological times can’t be relied on by those making prognostications and forecasts in the same way they could be up to perhaps as late as 1995.
Imagine using economic data from the pre-industrial revolution period to forecast economic trends after 1850.
If 17 years means anything today in the context of a short-term physical gold price prognostication, that is only by happenstance.