This article answers the question as to how far the employment situation in the U.S.  is from “normalizing” by analyzing 6 metrics to help answer the question. The conclusion is surprising. Read on.
The above introductory comments are edited excerpts from an article* from SoberLook.com entitled How close are the US labor markets to normalization?.
- the headline unemployment rate
- the so-called U-6 rate
- the part-time employment level
- the % probability of finding a job
- the labor force participation rate
- wage growth
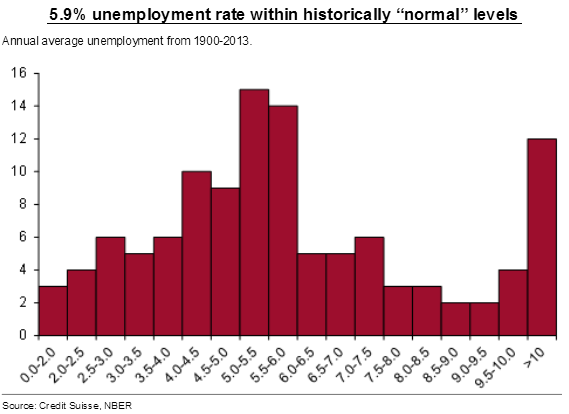
1. The chart below, for example, shows that the headline unemployment rate is now well within the normal range (based on long-term historical data) but, as we know, that’s only part of the story.
 |
| Source: Credit Suisse |
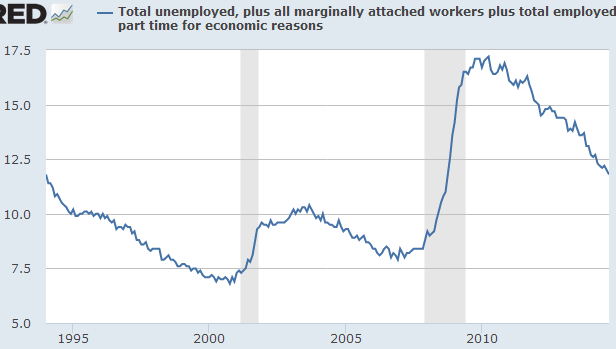
2. A broader gauge of unemployment, the so-called U-6 rate, which includes marginally attached workers and those employed part time for economic reasons, suggests the labor markets have some room for improvement.
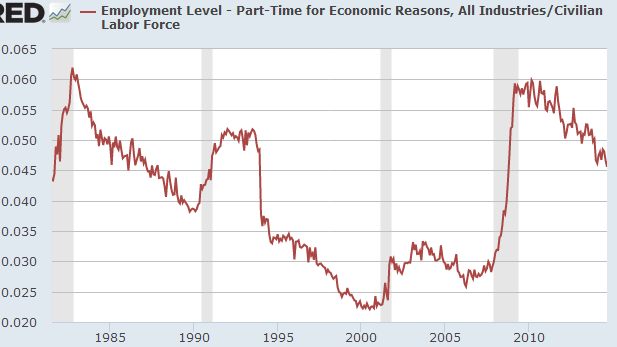
3. Within the U-6 metric it is particularly important to track the percentage of those employed part time for economic reasons. The current number of these workers (at just over 4.5% of the labor force) is not unusual by historical standards but is still quite elevated. It’s not at all clear however if we are ever returning to the lows of the decade that preceded the Great Recession.
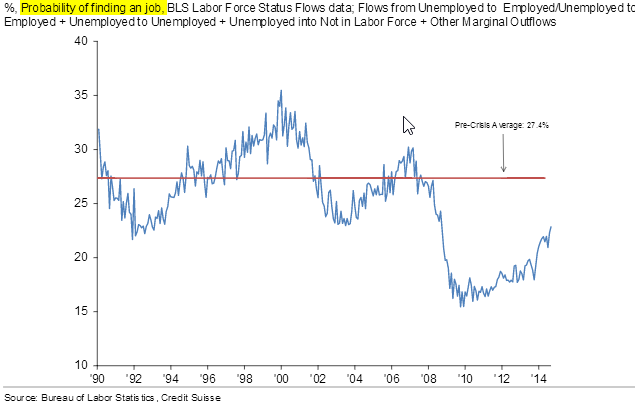
4. Another measure of labor markets’ health is an estimate of the “job finding rate” from Credit Suisse. At least based on the data since 1990 (which may not be a sufficiently long range), that metric is currently far below average. We do see signs of significant improvements recently but the red line in the chart below may no longer be our target for what is “normal”.
 |
| Source: Credit Suisse |
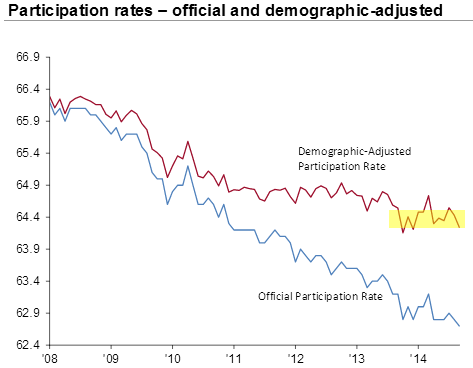
5. We’ve also seen a great deal of focus on falling U.S. labor force participation rate. The non-demographic component of the post-08 declines in participation rate is of particular importance. How much is due to aging U.S. population vs. the discouraged workers exiting the labor force?
 |
| Source: Credit Suisse |
There are hints that the non-demographic decline in participation has been halted, albeit at a relatively low level. The fact that the non-demographic participation level has fallen doesn’t say much about what it will take to return to “normal”. That’s because the pre-recession housing bubble had generated unsustainable demand for labor (particularly unskilled labor). That demand isn’t coming back any time soon as we look to establish the “new normal” in participation rate. We also see other factors impacting participation such as more disability claims and higher college enrollment rates.
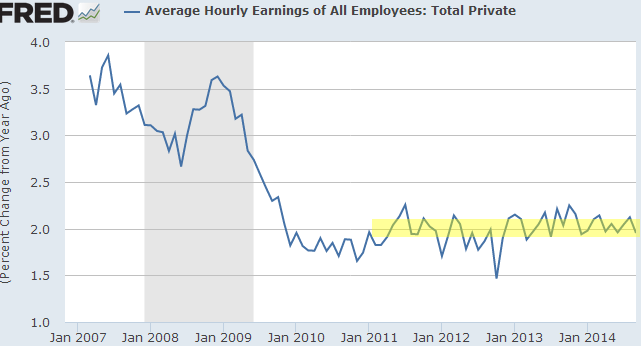
6. Finally we want to take a look at wage growth as an indicator of demand for labor. Wage growth in the U.S. remains remarkably steady, anchored at 2% per year. While this growth is certainly weak relative to recent history, it is quite respectable relative to other developed economies.
Editor’s Note: The author’s views and conclusions in the above article are unaltered and no personal comments have been included to maintain the integrity of the original post. Furthermore, the views, conclusions and any recommendations offered in this article are not to be construed as an endorsement of such by the editor.
If you liked this article then “Follow the munKNEE” & get each new post via
- Our Newsletter (sample here)
- Twitter (#munknee)
Related Articles: