The Phillip’s curve is obsolete. Inflation does not reliably depend on employment so what other  model could we depend on? Check out the model below that I have developed which strongly suggests core inflation has stabilized at around 2.2%.
The comments above and below are excerpts from an article by Edward Lambert (AngryBearBlog.com) which has been edited ([ ]) and abridged (…) to provide a faster and easier read.
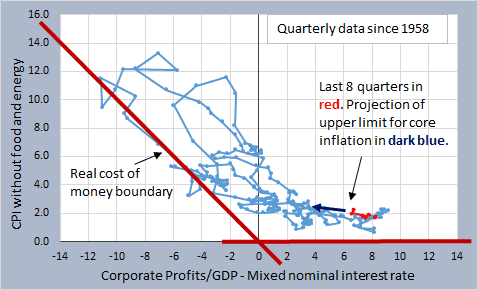
…[Below is a graph of] quarterly core inflation data (without food and energy) since 1958…[showing] the last 8 quarters of data highlighted in red.
…The dark blue arrow marks the predicted upper limit of core inflation according to the pattern set up in the model so the model predicts that core inflation will ride along or under this upper limit of around 2.2% as the data points move left [to right] on the graph.
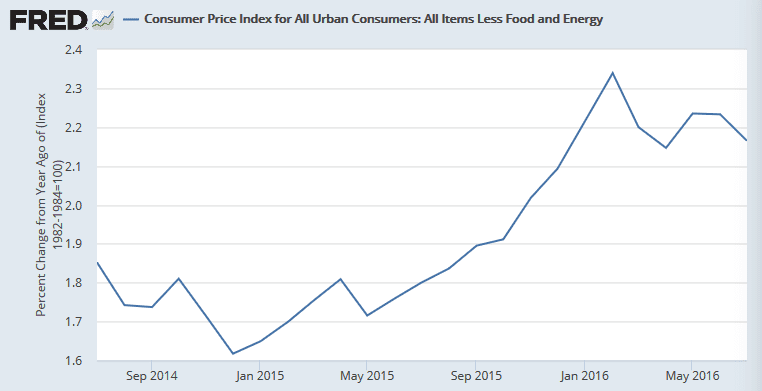
Does core inflation show signs of moving along the upper limit?…[Below is a graph of] core inflation over [the] last 8 quarters (monthly data).
Core inflation rose to around 2.2% and looks to have stabilized at the upper limit in the model above. I predict that core inflation will continue to follow closely to the projected upper limit.
Disclosure: The above article has been edited ([ ]) and abridged (…) by the editorial team at  munKNEE.com (Your Key to Making Money!)
  to provide a fast and easy read.
“Follow the munKNEE” on Facebook, on Twitter or via our FREE bi-weekly Market Intelligence Report newsletter (see sample here , sign up in top right hand corner)
Links to More Sites With Great Financial Commentary & Analyses:
ChartRamblings; WolfStreet; MishTalk; SgtReport; FinancialArticleSummariesToday; FollowTheMunKNEE; ZeroHedge; Alt-Market; BulletsBeansAndBullion; LawrieOnGold; PermaBearDoomster; ZenTrader; EconMatters; CreditWriteDowns;
 munKNEE.com Your Key to Making Money


